Fig. 7.
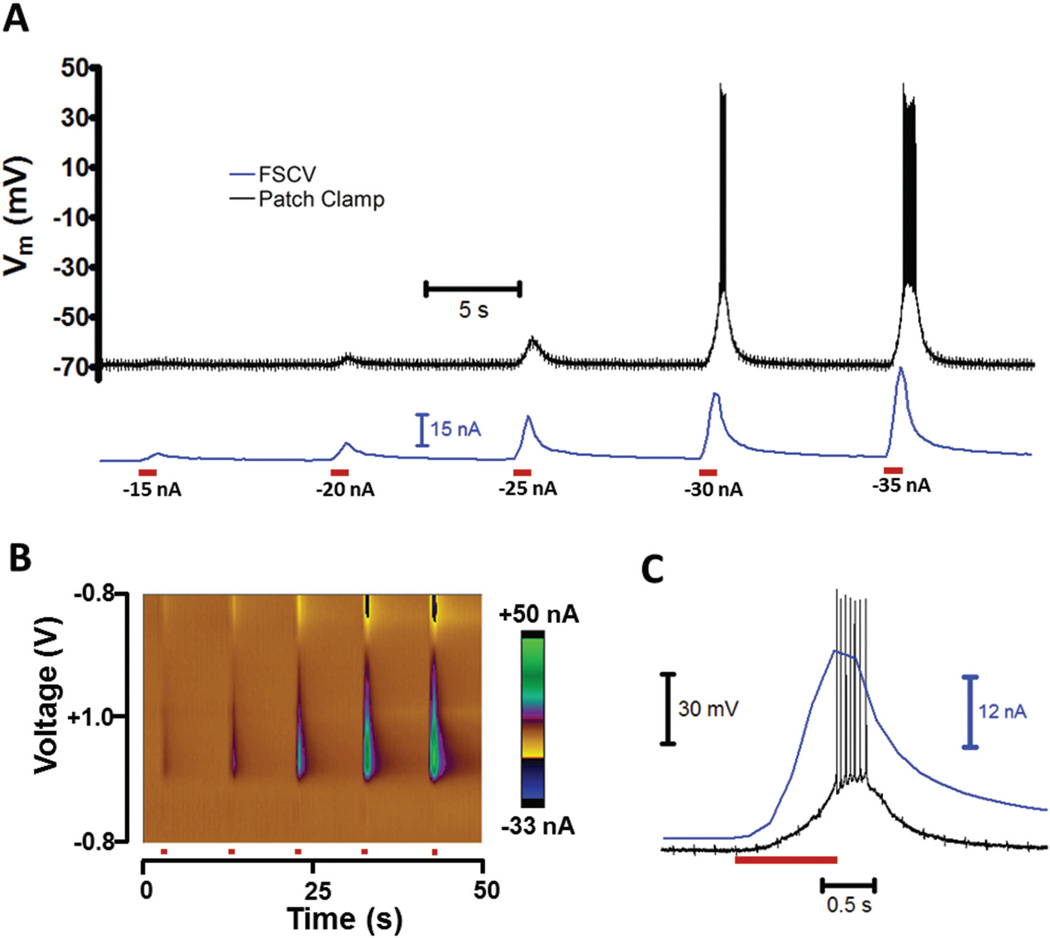
Concurrent FSCV and patch recordings during iontophoretic drug administration. (A) Physiological and chemical changes during iontophoretic ejections of glutamate and an electroactive marker. A multibarreled iontophoresis probe positioned ~10 µm from an MSN was used to perform 1 s ejections (red bars) of glutamate, an excitatory neurotransmitter, and DOPAC, the marker. A carbon-fiber electrode on the probe was used to perform FSCV, which detected the ejection of the marker (blue). The cell membrane potential (black) was recorded in a whole-cell current clamp. (B) Color plot of the FSCV current for ejections in A. (C) Time-course of −30 nA ejection in A.

