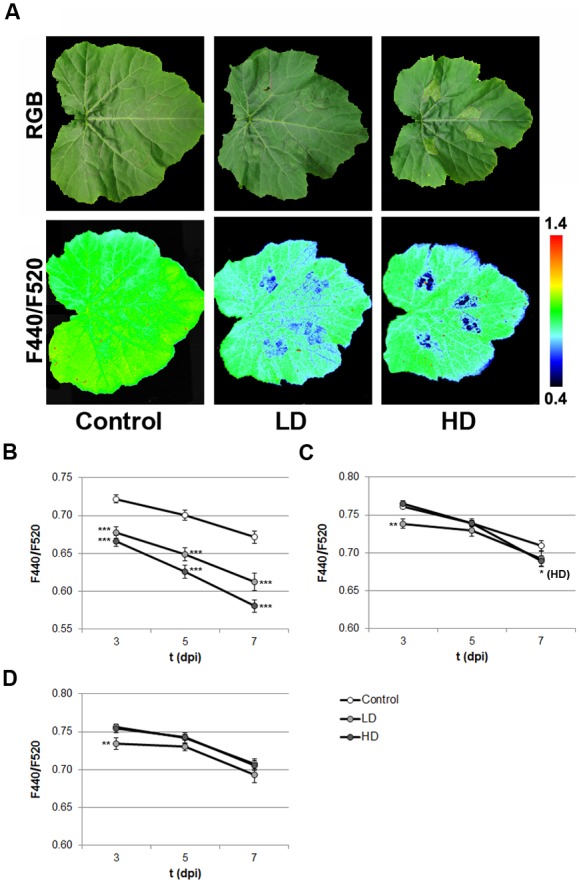
FIGURE 2.

(A) Standard F440/F520 images of mock-control, LD, and HD-inoculated zucchini leaves at 3 dpi, and their corresponding RGB images. Progression of F440/F520 signal in I (B), N (C), and D (D) areas of the leaves along the period of study. Symbols ∗, ∗∗, and ∗∗∗ stand for p < 0.1, 0.01, and 0.001, respectively.
