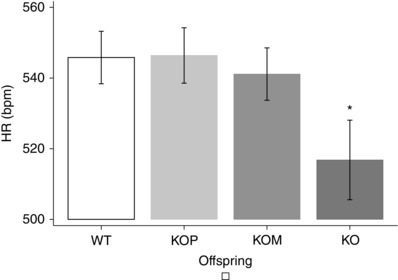
Figure 4. Heart rate and offspring genotype .

* P < 0.05 vs WT, KOP, KOM, post hoc analysis after multivariate estimation using Wald test: differences in mean HR values are displayed according to animals’ genotype, after controlling for age, sex, locomotor activity, time of haemodynamic recordings and time from transducer insertion. SBP, systolic blood pressure; DBP, diastolic blood pressure; MAP, mean arterial pressure. Data presented as mean ± SEM.
