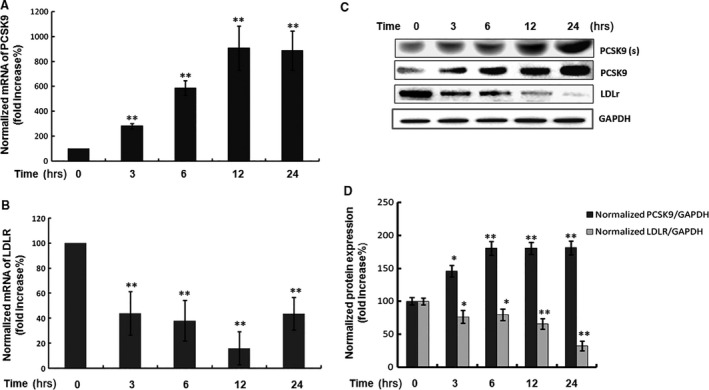
Figure 1.

Time course of the protein and mRNA expressions of PCSK9 and LDLR response to CRP treatment in HepG2 cells. (A) Real‐time quantification of the PCSK9 mRNA level and (B) LDLR mRNA level; (C) Western blot analyses of extracellular PCSK9 [PCSK9(s)] and intracellular PCSK9 and LDLR protein levels in HepG2 cells treated with CRP (10 μg/ml) for 0, 3, 6, 12 and 24 hrs. (D) The normalized intensity of intracellular PCSK9 versus GAPDH was presented as the mean ± SEM of three independent experiments. Significance: *P < 0.05, **P < 0.01 versus the 0 hr group. CRP, C‐reactive protein; PCSK9, pro‐protein convertase subtilisin/kexin type 9; LDLR, low‐density lipoprotein receptor.
