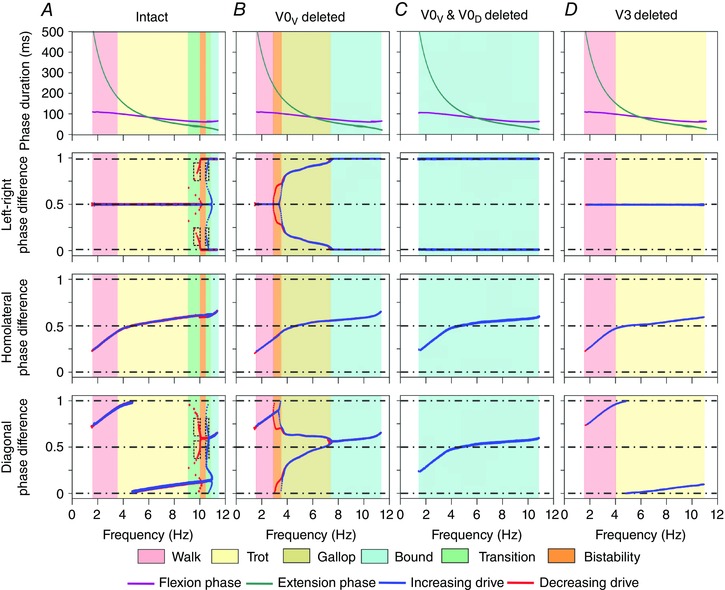
Figure 3. Flexion and extension phase durations and phase differences as functions of locomotor frequency in the intact case (A), and after removal of V0V (B), both V0V and V0D (C) or V3 commissural interneurons (D) .

Top row shows dependence of flexion and extension phase durations on locomotor frequency. The next rows, from top to bottom, show left–right, homolateral and diagonal phase differences in two cases when brainstem drive increased (blue) and decreased (red). Background colours indicate areas corresponding to particular gaits (similar to Fig. 2) as well as areas of transitional regimes and bistability. Ablation of V0V caused a loss of trot (B), ablation of both V0 CINs resulted in the expression of only bound (C), and ablation of V3 resulted in the expression of only walk and trot (D). To produce these diagrams, the parameter α was linearly increased and then decreased (see Methods).
