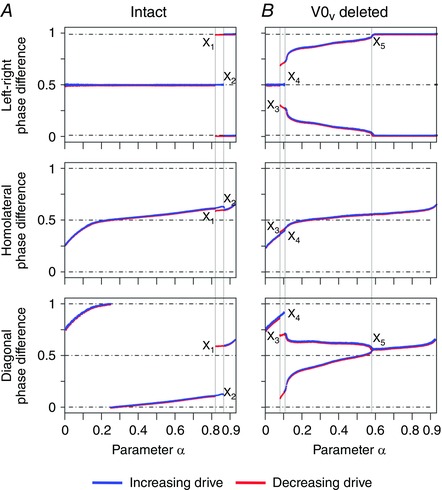
Figure 4. Bifurcation diagrams for the intact model (A) and following removal of V0V commissural interneurons (B) .

Steady state phase differences were calculated with stepwise increases of α (see Methods). X1, X2, X3, X4 and X5 are the values of α at which discontinuities in the bifurcation diagrams occurred.
