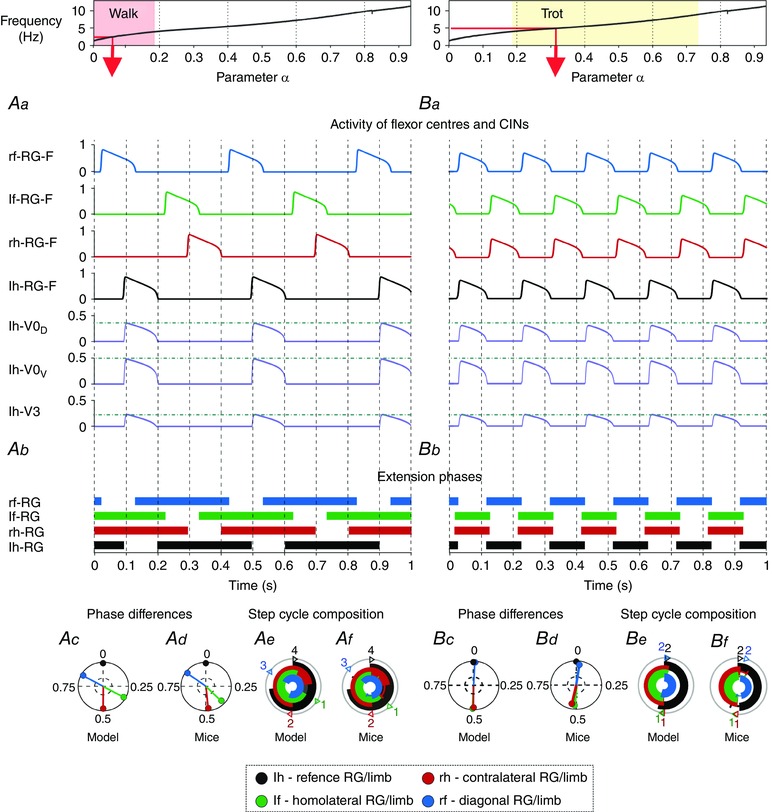
Figure 5. Model performance during walk and trot .

Top diagrams show the α‐dependent areas when walk (Aa–Af) and trot (Ba–Bf) were expressed. Red arrows specify α and frequency that correspond to the illustrated examples shown below. Aa and Ba, outputs of four flexor centres (RG‐Fs) and left hind commissural (V0D, V0V and V3) interneurons (CINs). Horizontal lines indicate maximal activity for each group of CINs. Ab and Bb, corresponding extension phases of all rhythm generators (RGs). Ac and Bc, circular plots of phase differences (referenced to left hind RG). Ad and Bd, same circular plots modified from the experimental study of Bellardita & Kiehn (2015, fig. 1F, with permission). Ae and Be, circular bar graphs of the extension phase normalized to the step cycle. Af and Bf, circular bar graphs of stance phases modified from the experimental study of Bellardita & Kiehn (2015, fig. 1G, with permission). Experimental graphs (Af, Bf) were adjusted to correspond in style to Ae and Be). Abbreviations: F, flexor; f, fore; h, hind; l, left; r, right.
