Figure 2.

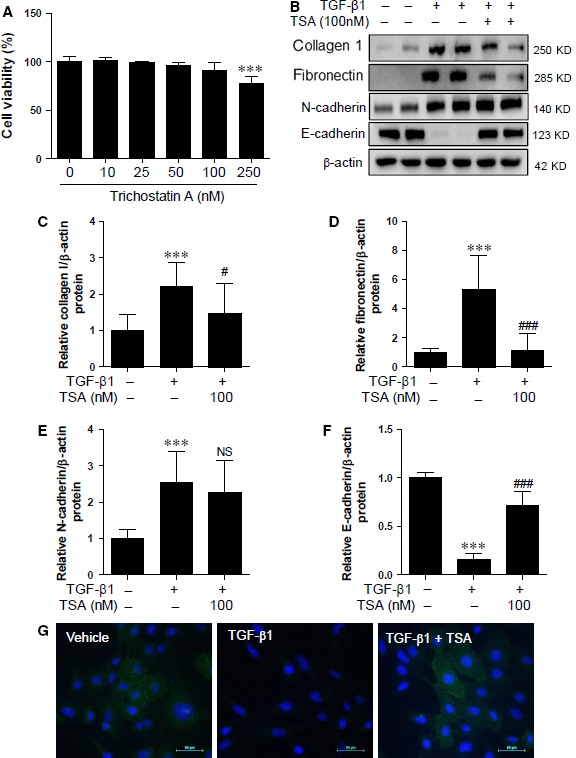
TSA regulates TGF‐β1‐mediated ECM proteins and E‐cadherin in HK2 cells. (A) HK2 cells were treated with increasing concentrations of TSA (0, 10, 25, 50 100 and 250 nM) for 24 hrs and cell viability was measured by the MTT assay. (B) HK2 cells were co‐treated with TGF‐β1 (5 ng/ml) and TSA (100 nM). ECM proteins and EMT markers were determined using Western blot analysis. Representative immunoblots are shown. β‐Actin was used as the loading control. (C–F) Quantification was performed by densitometry for at least four independent experiments. (G) Representative immunofluorescence images for E‐cadherin in HK2 cells. Immunofluorescence staining was performed using anti‐E‐cadherin antibody and DAPI was used for staining cell nuclei. Merged images are shown. Scale bar represents 50 μm. ***P < 0.001 compared with untreated cells. # P < 0.05 and ### P < 0.001 compared with TGF‐β1‐treated cells. NS, not significant.
