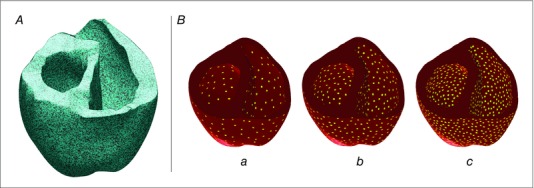
Figure 2. Models of opsin delivery and illumination .

A, opsin distribution in the human ventricular model. Blue: opsin‐transfected tissue; black: tissue without opsins. B, Optrodes on the endocardial and epicardial surfaces in yellow. Three different optrode densities: a, 1.15 cm–2; b, 2.30 cm–2; and c, 4.61 cm–2.
