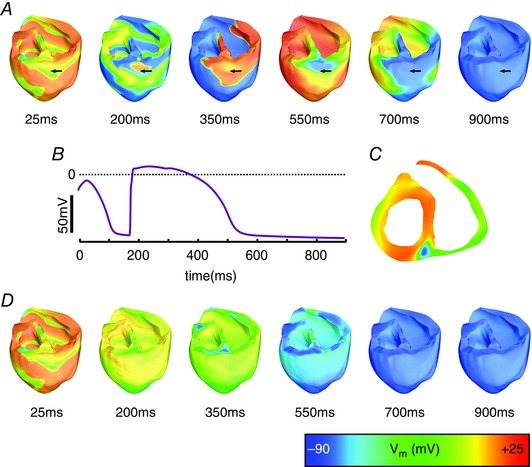
Figure 6. Successful defibrillation with ChR2‐RED+ .

A, V m maps following illumination of ventricles with ChR2‐RED+ (enhanced light sensitivity) via a dense (4.61 cm–2) optrode array, with light pulse duration 25 ms and onset at 0 ms. B, V m at surface node denoted with arrows in A. C, cutaway view (same level as the arrows in A) at time = 100 ms in the same simulation. D, V m maps following stimulation with the same configuration as in A above, but with 500 ms light pulse duration. Videos S6 and S7 in ‘Supporting Information’ correspond to V m sequences in A and D, respectively.
