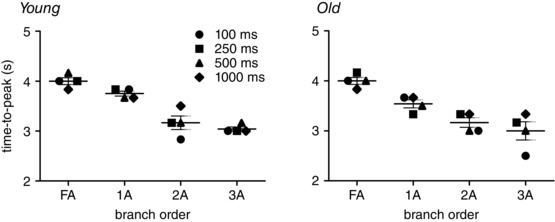
Figure 5. ROV peaks earlier in downstream branches of the resistance network .

The time‐to‐peak for ROV decreased as branch order increased (FA>1A>2A>3A) in GM of both young mice (R 2 = 0.950) and old mice (R 2 = 0.986). For each branch order, the time‐to‐peak ROV was consistent across contraction durations for both age groups. Note temporal lag between downstream 3A and upstream FA, particularly in old mice for 100 ms contraction. Each data point represents the mean value for given duration from n = 6; horizontal bar for each branch indicates mean time‐to‐peak ± SEM across contraction durations.
