
Figure 2. Relationship between age and frailty in mice .
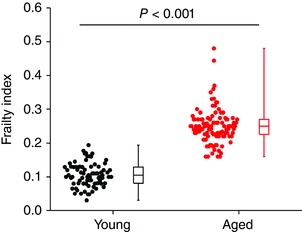
Two groups of male C57BL/6 mice were used in this study including a group of young mice with a mean age of 13.7 ± 0.4 weeks (n = 77) and a group of aged mice with a mean age of 101.8 ± 1.0 weeks (n = 109). Graph shows the summary of differences in FI score between young and aged mice. Data analysed using Student's t test.