
Figure 7. Beat to beat variability in leading pacemaker site .
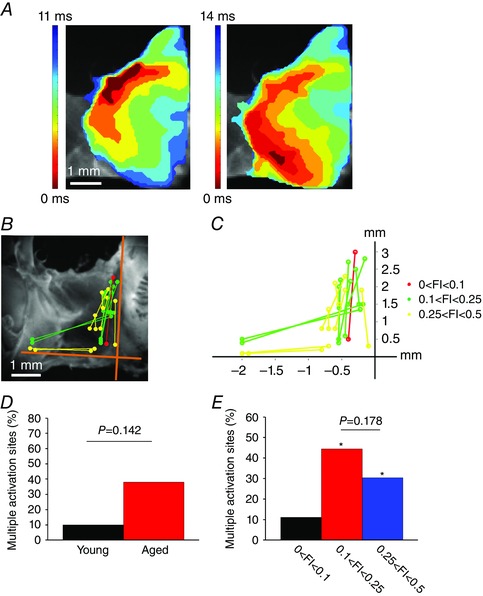
A, representative activation maps from two consecutive heart beats in the same heart showing variability in the location of the leading pacemaker site (as indicated by the red colour at 0 ms). In this example, the leading pacemaker site shifted between superior (left) and inferior (right) locations. Time interval between isochrones is 1.4 ms. Scale bar is the same for both maps. B, location of leading pacemaker sites in all hearts that showed more than one activation site. Distinct leading pacemaker sites for each individual heart are connected by lines. Colours represent three different FI ranges as indicated. C, quantification of the magnitude of shifts in leading pacemaker site in hearts showing more than one activation site. D, percentage of hearts (young vs. aged) that showed multiple activation sites. Data analysed using Fisher's exact test. E, percentage of hearts showing multiple activation sites as a function of FI. * P < 0.05 vs. lowest FI group (black bar). Data analysed using Fisher's exact test.