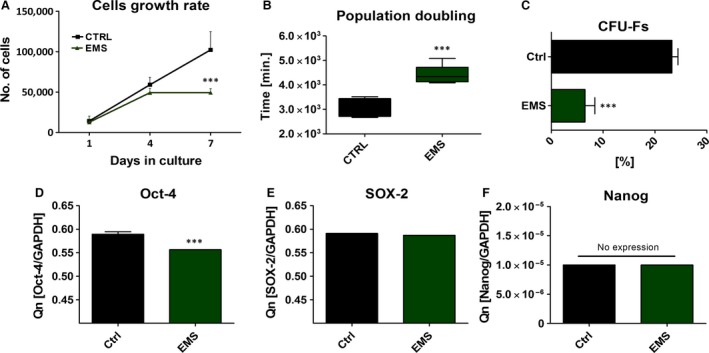
Figure 2.

Evaluation of growth kinetics, PDT and clonogenic potential of ASCs. Mean cell number for each group with respect to culture duration (A). ASCEMS showed decreased proliferation potential, especially on seventh day of culture (P < 0.001). In respect to growth curve data, mean population doubling time was calculated (B). CFU‐E assay showing percentage of colonies consisting of more than 50 cells between groups after 7 days of culture (C). The expression of Oct‐4 (D), Sox‐2 (E) and Nanog (F) evaluated with RT‐PCR after day 7th. Obtained data indicate on decreased proliferation rate, clonogenic potential and ‘stemness’ of ASCEMS. Results are expressed as mean ± S.D. ***P < 0.001.
