
Figure 3.
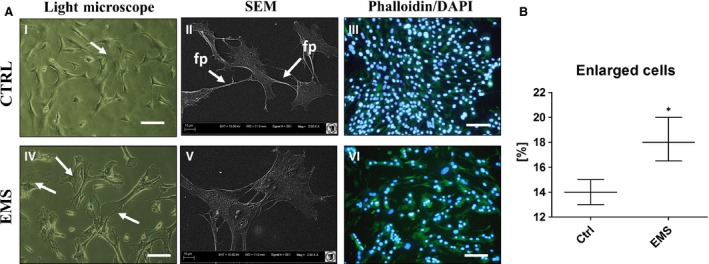
Assessment of ASCs morphology. Using multiple types of cells imaging allowed to visualize cells morphology in investigated groups (A) after 7 days of culture. Light microscope (I, IV) pictures with white arrows indicating cells with enlarged bodies as a sign of cellular senescence and apoptosis. SEM images (II, V) confirmed that ASCEMS were characterized by more flattened and spread‐out shape. Moreover, in control group we observed long cytoskeletal projection called filopodia (indicated with white arrows as fp), which connect neighbouring cells and plays crucial role in intracellular signalling. Staining for actin filaments and nuclei (III, VI) revealed that in control group cells were concentrated more densely and closely adhere to each other and formed multi‐layer, whereas in EMS group cells reached about 70% of confluence. Moreover, some of those cells were amorphous in shape and no longer bipolar with enlarged nuclei. Additionally, based on representative photographs, we calculated percentage of enlarged cells, which was elevated in EMS group (B). Magnification ×100 (light and fluorescence microscopy), scale bars: 250 μm. Results expressed as mean ± S.D., *P < 0.05.