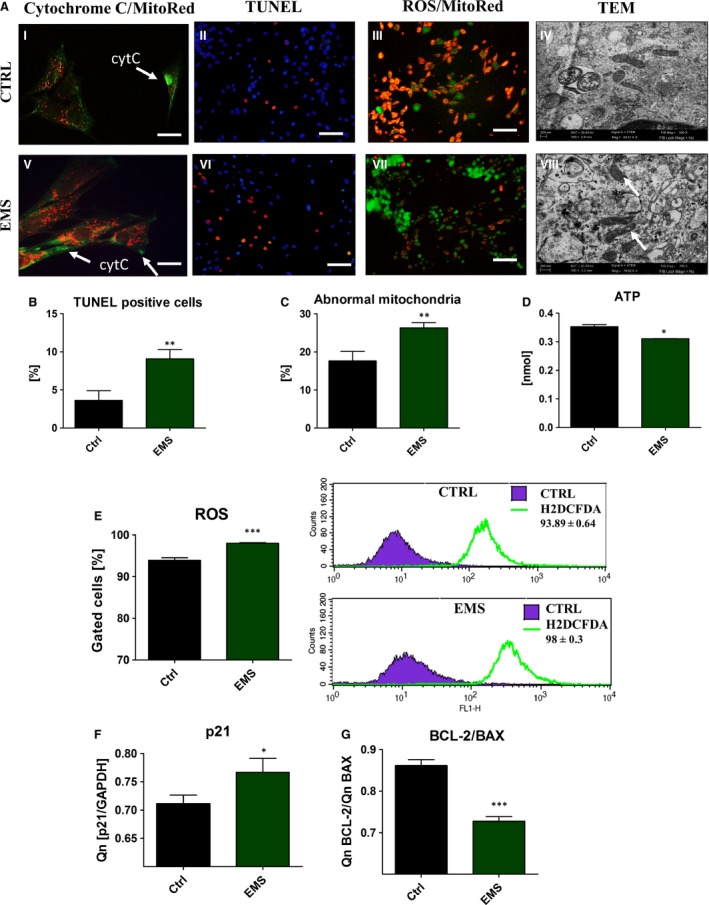
Figure 6.

Oxidative stress and mitochondria morphology in ASC after 7 days of culture. ASC were stained with cytochrome c antibody and MitoRed dye to determine the subcellular localization of cytochrome c (green) and mitochondria (red), cytC‐ cytochrome c (A). Representative pictures shows cytochrome c relocation to cytoplasm in ASCEMS. To evaluate the levels of apoptosis in investigated cultures TUNEL staining was performed (II, VI). Merged pictures revealed that most of ROS was derived from mitochondria (III, VII). To determine if EMS affects mitochondrial structure in ASC, transmission electron microscopy was performed. Representative photographs (IV, VIII) showed accumulation of abnormal mitochondria in ASCEMS. White arrows indicate on mitochondria with disarrayed cristae, membrane raptures and vacuoles within the matrix. Those defects have been correlated with mitochondrial fission, metabolic disorders and cell death. Based on the representative photographs TUNEL positive cells were calculated (B). Percentage of abnormal mitochondria with membrane raptures and vacuole formation was calculated (C) based on TEM photographs. Moreover, we observed decreased ATP levels in ASCEMS, which may result from dysfunctional mitochondria in those cells (D). Additionally, to evaluate whether mitochondria dysfunction influence oxidative status of ASC and accumulation of intracellular ROS levels were evaluated with flow cytometer (E). Flow cytometer histograms are shown next to the box plot. Using RT‐PCR we also established expression of p21 (F), which was increased in ASCEMS (P < 0.05). Moreover, the ratio of BCL‐2/BAX expression was significantly lower (P < 0.001) in ASCEMS making those cells more susceptible for apoptosis (G). Magnification ×100 (fluorescence microscopy), scale bars: 250 μm. Results expressed as mean ± S.D., *P < 0.05, **P < 0.01, ***P < 0.001.
