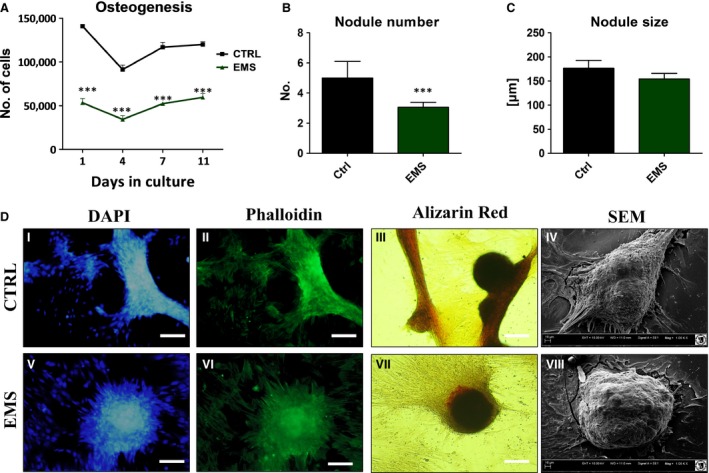
Figure 7.

Osteogenic differentiation of ASC after 11 days of propagation. ASCEMS displayed decreased proliferation rate during osteogenic culture in comparison to control group (A, P < 0.001). Based on the SEM results mean nodule number and size was estimated. Although, ASCEMS produced less number of bone nodules (B, P < 0.001) we did not observed differences in their size among groups (C). Visualization of cellular morphology with DAPI/Phalloidin (I, II, V, VI) showed formation of dense cellular aggregates, whereas Alizarin Red stained extracellular mineralized matrix (III, VII). SEM pictures of bone nodules revealed no differences in their size among investigated cells (IV, VIII). Magnification ×100, scale bars: 250 μm. Results expressed as mean ± S.D. ***P < 0.001.
