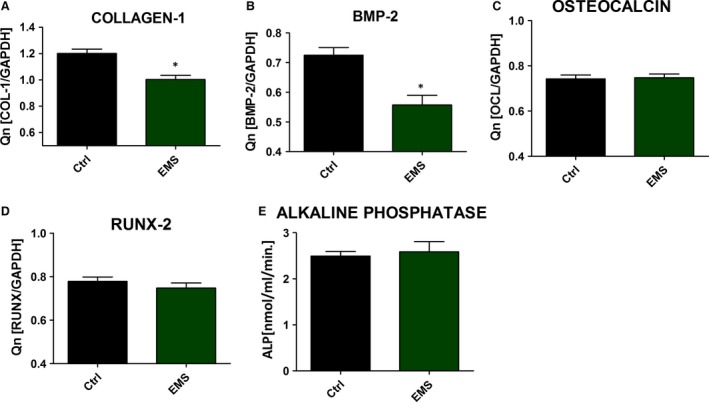
Figure 8.

Evaluation of protein expression during osteogenic differentiation. RT‐PCR results for collagen‐1 (A), BMP‐2 (B), osteocalcin (C) and RUNX‐2 (D). Activity of alkaline phosphatase (E). Data were obtained from the 11th day of experiment. Results expressed as mean ± S.D., *P < 0.05.
