Figure 10.

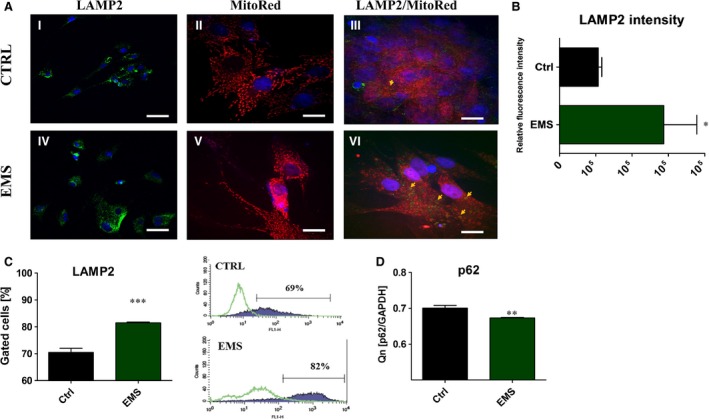
The evaluation of LAMP2 after 7 days of culture. Cells were stained with anti‐LAMP2 antibody and observed under confocal microscope (I, IV). Additionally mean fluorescence intensity of LAMP2 was evaluated (B). Moreover, using MitoRed we evaluated the net of mitochondria in investigated ASCs (II, V). In control group, mitochondria were more dense, robust, forming long, interconnected tubular network, located evenly within the cytoplasm. In ASCEMS mitochondria were located mainly in the area of the nucleus and presented as a round, separate tubules. Moreover, merged photograph of MitoRed/LAMP2 revealed increased formation of mitophagosomes in ASCEMS (III, VI). For more quantitative data LAPMP2 amount was estimated with flow cytometer (C). Obtained results confirmed immunofluorescence stainings. The amount of p62 was decreased in ASCEMS (P < 0.01), indicating on increased autophagy in those cells (D). *P < 0.05, ***P < 0.001. Magnification ×10 LAMP2, scale bars 20 μm, MitoRed, Mitored/LAMP2 magnification ×20, scale bars 10 μm.
