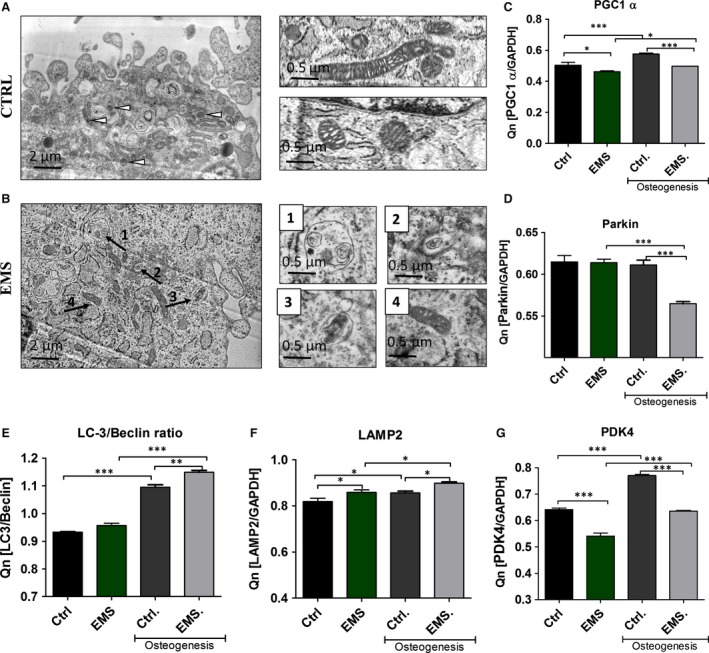
Figure 11.

Autophagy and mitochondrial biogenesis in control and osteogenic conditions. TEM imaging revealed increased formation of autophagosomes and autolysosomes in ASCEMS (B). Moreover, we observed clearance of dysfunctional mitochondria through autophagy. Higher magnification images of indicated with arrows regions are shown on the right. PGC1 α expression indicates on increased mitochondria biogenesis during osteogenesis in ASC (C), while Parkin expression on the removal of dysfunctional mitochondria by mitophagy (D). The ratio of LC‐3/Beclin 1 suggest increased autophagosome formation during osteogenesis (E) while LAMP‐2 expression of increased formation of autolysosomes which are required to complete the process of autophagy (F). Additionally mRNA levels of PDK4 was evaluated (G). Magnification ×30k. Results expressed as mean ± S.D., *P < 0.05, **P < 0.01, ***P < 0.001.
