Figure 12.

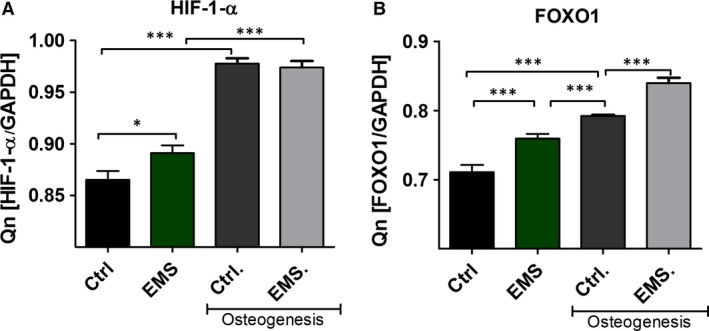
The expression of HIF‐1‐α and FOXO1. Using RT‐PCR the mean mRNA levels of HIF‐1‐α (A) and FOXO1 (B) was established. The expression of both transcripts increases during osteogenic differentiation of ASCs. *P < 0.05, ***P < 0.001.

The expression of HIF‐1‐α and FOXO1. Using RT‐PCR the mean mRNA levels of HIF‐1‐α (A) and FOXO1 (B) was established. The expression of both transcripts increases during osteogenic differentiation of ASCs. *P < 0.05, ***P < 0.001.