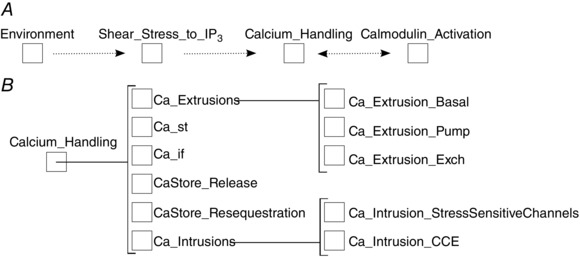
Figure 3. The biological component hierarchy of the Signalling Example model .

A, the top level of the hierarchy, with large cohesive modules (dotted lines indicate general flow of information; free intracellular calcium modulates both IP3 generation and calmodulin activation). B, the nested nature (brackets indicate encapsulation relationships) of the Calcium_Handling module, which are constructed from smaller cohesive components representing sub‐modules. Similar sub‐hierarchies could be drawn for Shear_Stress_to_IP3 and Calmodulin_Activation components.
