
Figure 1. R-GECO1 Exhibits Enhanced Ca2+-Dependent Signal Change Compared with NES-YC3.6.
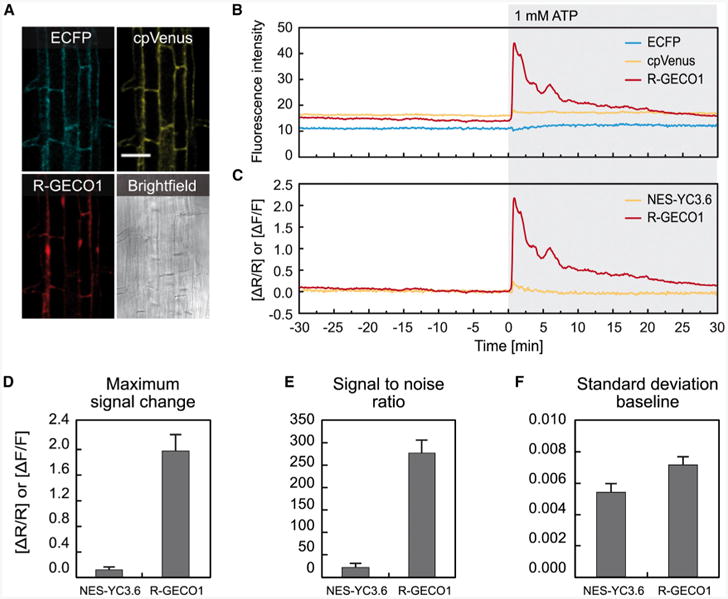
Ca2+-dependent signal changes in response to 1 mM ATP in roots of 6- to 8-day-old seedlings expressing NES-YC3.6 and R-GECO1.
(A) Fluorescence images of ECFP, cpVenus, R-GECO1, and corresponding bright field image. Scale bar represents 50 μm.
(B) Time-dependent fluorescence intensities.
(C) Time-dependent normalized NES-YC3.6 emission ratios (ΔR/R) and normalized R-GECO1 fluorescence intensities (ΔF/F).
(D–F) Maximum signal change (D), signal-to-noise ratios (E), and SD of the baseline (F). Error bars represent SD of three independent experiments.