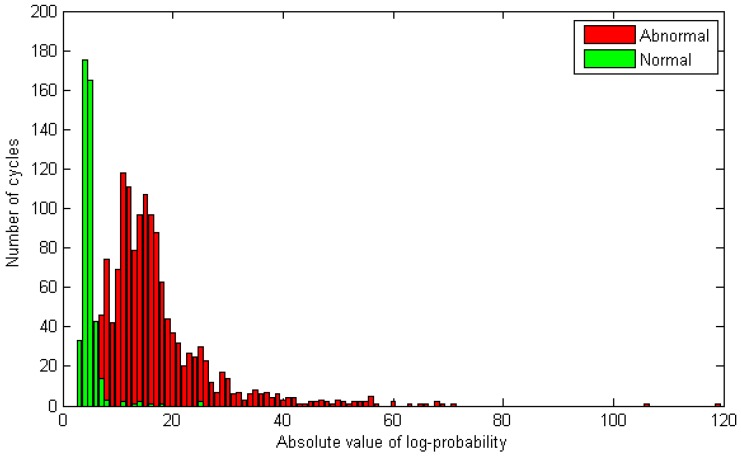
Figure 7.
Absolute values of log-probabilities, in Equation (2), calculated from HMM output. Green and red color represent normal and abnormal gaits, respectively. The threshold is estimated in the training process. Some samples are not shown in this figure because they were outside the range displayed here.

