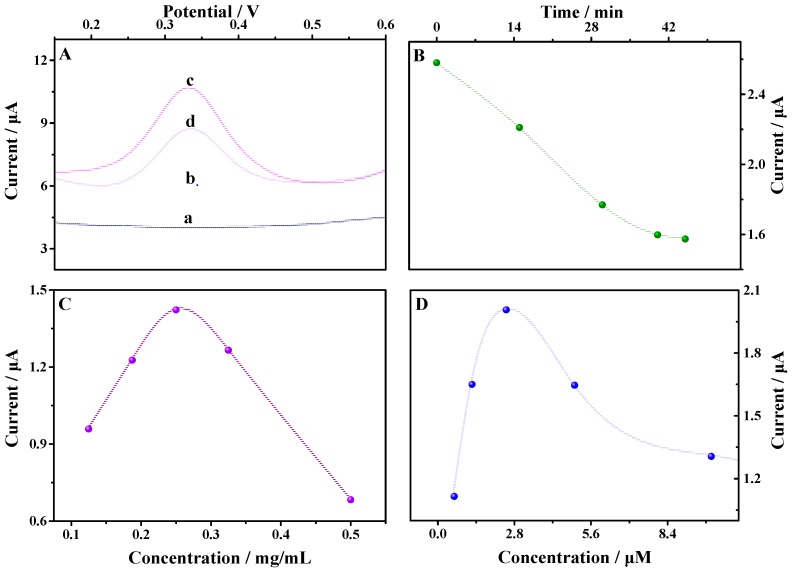
Figure 5.
(A) Differential pulse voltammetry (DPV) of the bare electrode (curve a), TCPP–Gr/AuNPs/GCE (curve b), MbBA–Fc/TCPP–Gr/AuNPs/GCE (curve c), and MbBA–Fc/TCPP–Gr/AuNPs/GCE in 4.4 × 10⁻⁷ M myoglobin solution (curve d); (B) The relationship between the peak current and the incubated time; (C) The effect of the concentration of TCPP–Gr/AuNPs on the peak current; (D) The effect of the concentration of MbBA on the peak current (Amplitude: 50 mV, pulse width: 0.050 s).

