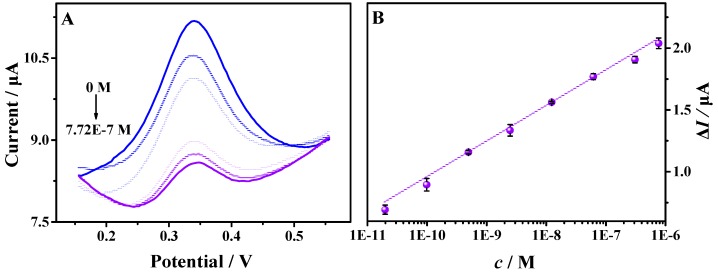
Figure 6.
(A) DPVs of the biosensor for different concentrations of myoglobin: 0.00 M, 2.00 × 10⁻¹¹ M, 1.00 × 10⁻¹⁰ M, 5.00 × 10⁻¹⁰ M, 2.50 × 10⁻⁹ M, 1.25 × 10⁻⁸ M, 6.18 × 10⁻⁸ M, 3.09 × 10⁻⁷ M, and 7.72 × 10⁻⁷ M in 5.0 mL 0.10 M PBS (pH = 7.4); (B) The calibration curve between the peak current changes and the myoglobin concentration (logarithm). The measurements were repeated 3 times to obtain the standard deviation. (Amplitude: 50 mV, pulse width: 0.050 s).

