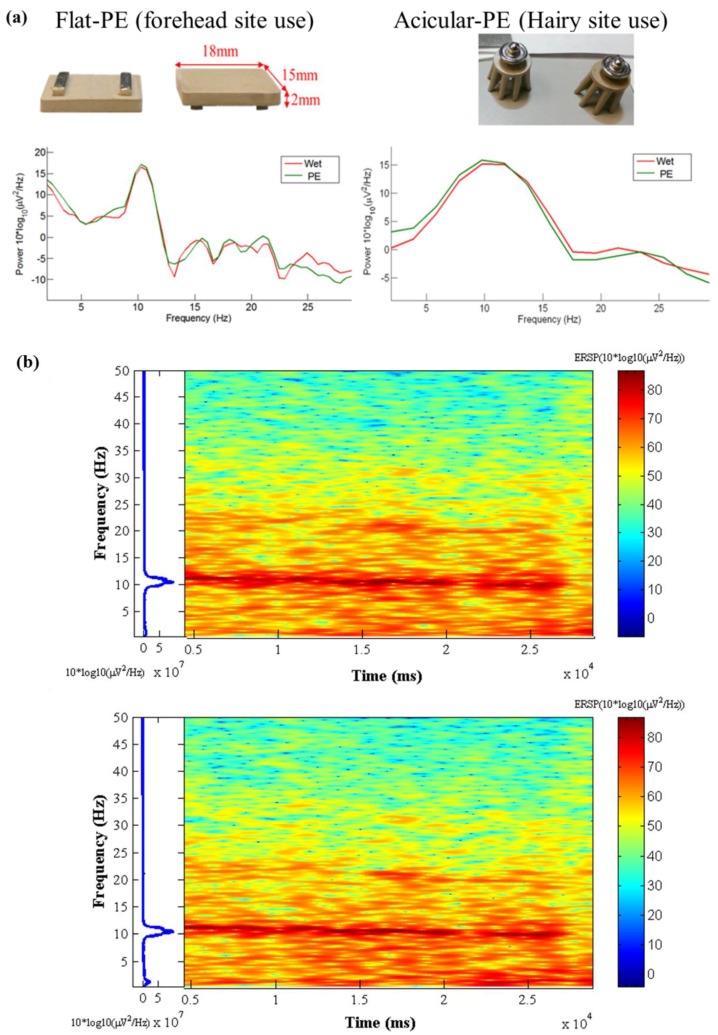
Figure 9.
(a) Alpha rhythm tests. The left diagram is the forehead EEG data and the right is the occipital EEG data. Wet sensors were located at Fp1and Oz and the proposed dry PEs were located near Fp1 and Oz; (b) Time-frequency analysis of the EEG signals (Oz) for 0~50 Hz spectrum. The top diagram is the wet sensor’s result located at Oz, and the bottom diagram is the proposed PE’s result located near Oz.

