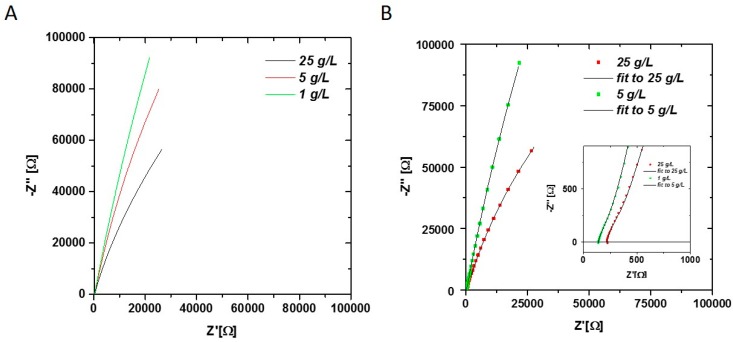
Figure 2.
(A) Nyquist plot of E. coli samples at different concentrations (1–25 g/L) measured in offline mode. Obvious changes in the double layer are visible at low frequencies; (B) Nyquist plot of 1 g/L and 25 g/L sample with fit using equivalent circuit in Equation (1). Fitted parameters all three samples are given in Table 1. The Q value of the CPEdl element is strongly dependent on the biomass concentration.

