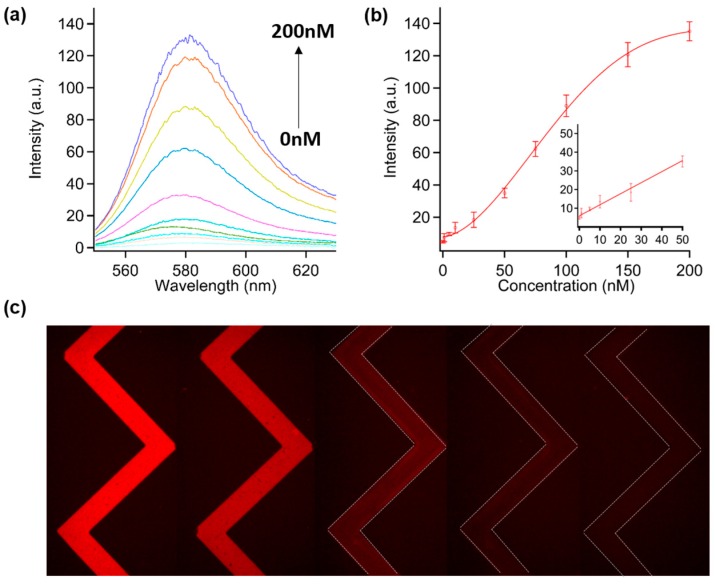
Figure 3.
(a) Fluorescence spectra of P1 with a variety of T1 (0, 1, 5, 10, 25, 50, 75, 100, 150, and 200 nM) in the presence of MoS2/MWCNT (250 μg/mL); (b) Calibration curve for DNA detection; (c) Fluorescence images of P1T1 in the presence of various T1 concentrations (left to right; 150, 100, 75, 50 and 10 nM). The concentration of P1 is 100 nM.

