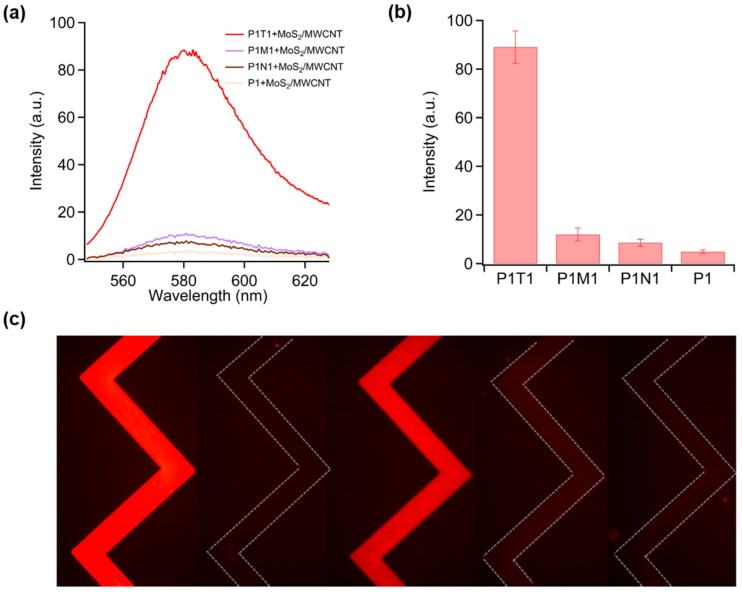
Figure 4.
(a) Fluorescence spectra of 100 nM P1, P1T1, P1M1, and P1N1 in the presence of MoS2/MWCNT; (b) Selectivity of the MoS2/MWCNT-based target DNA (T1) sensor over single-base mismatched (M1) and non-complementary (N1) sequences; (c) Fluorescence images of P1, P1/(MoS2/MWCNT), P1T1/(MoS2/MWCNT), P1M1/(MoS2/MWCNT), and P1N1/(MoS2/MWCNT) from left to right. P1, T1, M1, and N1 have the same concentration of 100 nM.

