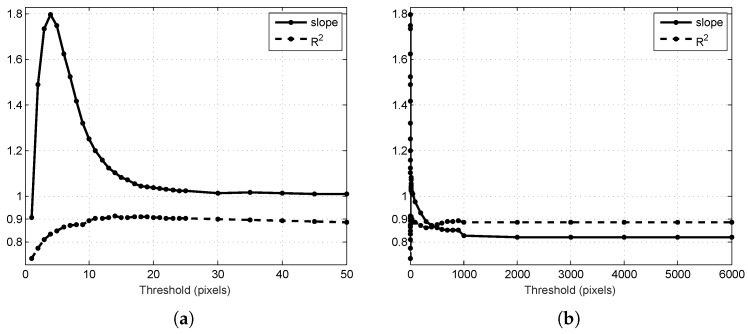
Figure 6.
Performance of the algorithm for different threshold values: (a) in the region of reasonable values; (b) for ranges up to the size of the images. In both cases, values nearer to one indicate better performance. Higher values indicate better precision, and a slope nearer to one indicates better accuracy, compared to the harvest fruit counts for the 16 target trees.

