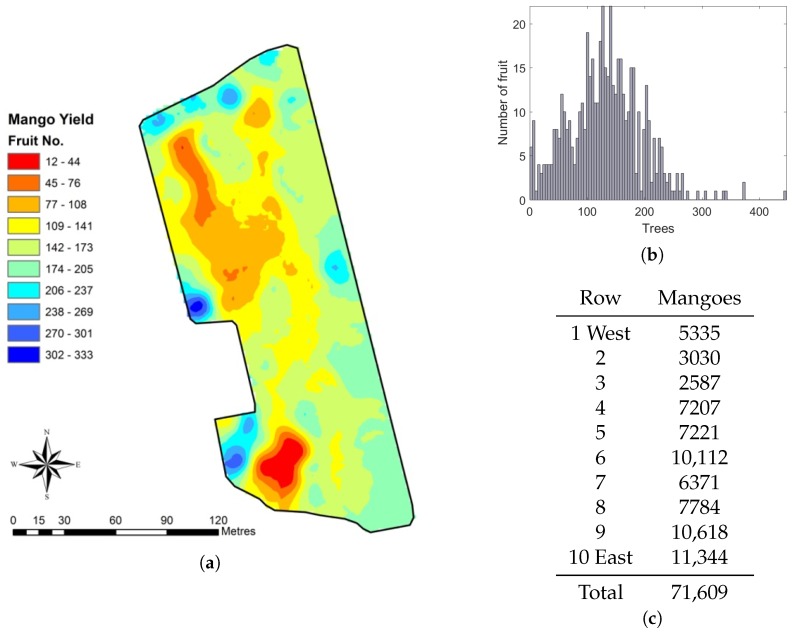
Figure 14.
Spatial fruit statistics from the proposed multi-view method: (a) yield map of the orchard block, coloured by the number of fruit per tree; (b) histogram of fruit per tree; and (c) the estimated number of of mangoes for each row and the total. The first three rows have significantly lower yield because of the placement of a shed near the south end. The yield on the other seven similar length rows varies significantly, from 6371 to 11,344. The unproductive block in the southwest corner was removed after these experiments.

