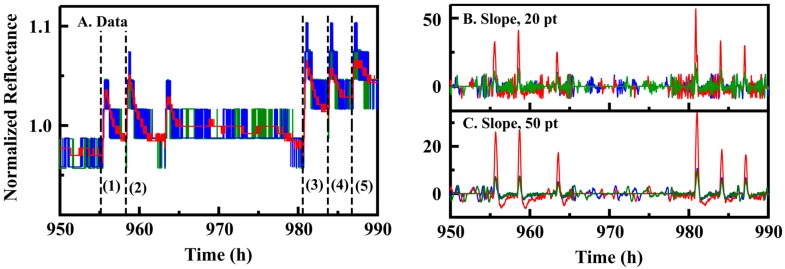
Figure 4.
(A) PT5 data (PT5; 30 s sampling interval; 100 ms integration) is presented including points collected during exposure to ethanol in the glove enclosure at maximum concentrations of 1.06 ppm (1, 2) and 1.58 ppm (3, 4, 5); The reported signals are red, green, and blue values for a single indicator. Also shown is the calculated slope versus time for the presented data using varied window lengths of 20 (B); and 50 (C) points.

