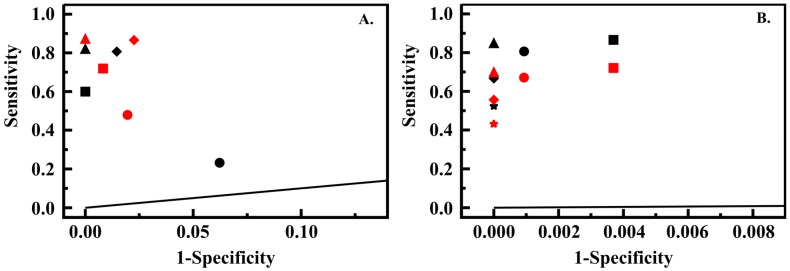
Figure 5.
(A) ROC analysis for PT5 data sets collected at 100 (circle), 200 (square), 400 (triangle) and 500 ms (diamond) integration when evaluated using the single seat (s1, black) and dual seat (s2, red) slope based algorithms; (B) ROC analysis of the 500 ms PT5 data set using 0.16 (black) and 0.05 (red) ppm detection thresholds with variations of the slope based algorithm: one seat, 0.45°, circle; two seat, 0.45°, square; three seat, 0.45°, triangle; one seat, 1.45°, diamond; one seat, 2.45°, star.

