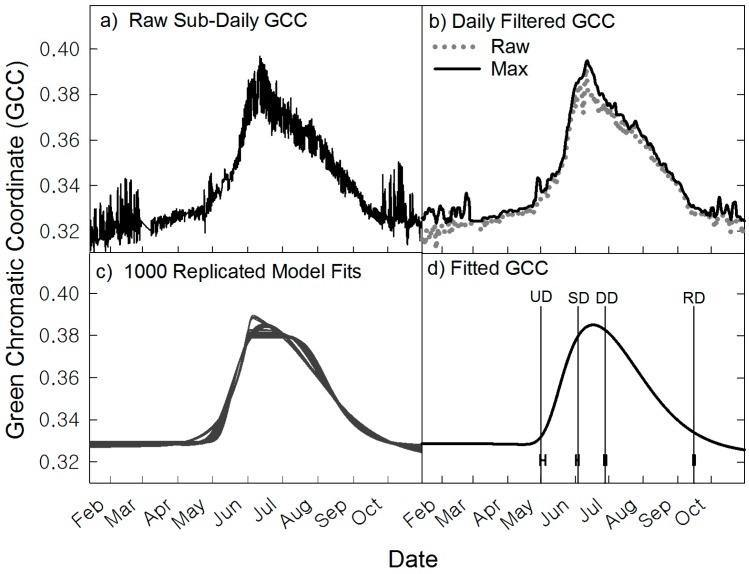
Figure 2.
An example from the wet meadow of processing raw RGB values. (a) Raw GCC values acquired from extracting the per-pixel RGB digital numbers averaged across the ROI; (b) Three filters were applied in the order: night, spline, max. Max filtered GCC values calculated from sub-daily data after night and spline filters are applied. Raw GCC values at daily time steps are also shown as gray dots; (c) Filtered data fitted with uniform distribution of residuals around the observed data points to estimate uncertainty (1000 replications, gray lines); (d) The fitted line and median phenophase dates (vertical lines) upturn date (UD), stabilization date (SD), downturn date (DD) and recession date (RD) and the 10th to 90th confidence intervals around those dates.

