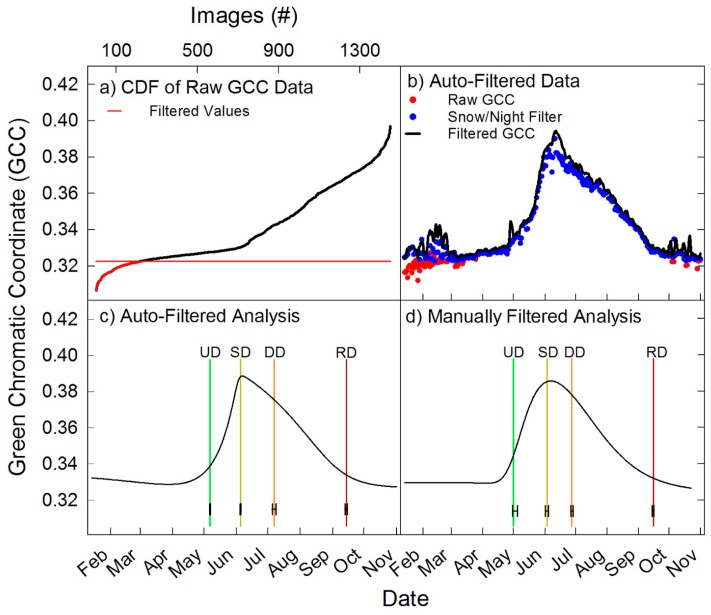
Figure 3.
Analyses of the wet meadow to demonstrate snow/night filter. (a) Cumulative distribution frequency of GCC for all images, with the red line being the first break in slope and data below this was removed with snow/night filter; (b) raw data (red dots) with snow/night filter shown as blue dots, and black line is with the max filter applied; (c) Fitted and threshold seasonal GCC values obtained with the snow/night filter; (d) Fitted and threshold seasonal GCC values obtained on manually filtered images.

