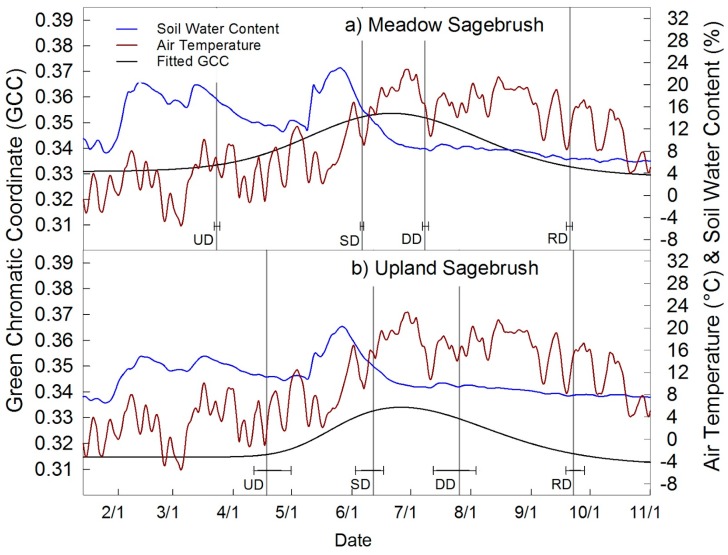
Figure 5.
Seasonal course of GCC and phenophase dates are shown for (a) the dry meadow sagebrush canopy and (b) for the upland sagebrush canopy, plotted with 3-day average air temperature and soil water content. The dry meadow sagebrush had a longer growing season and increased greenness relative to the upland sagebrush canopy.

