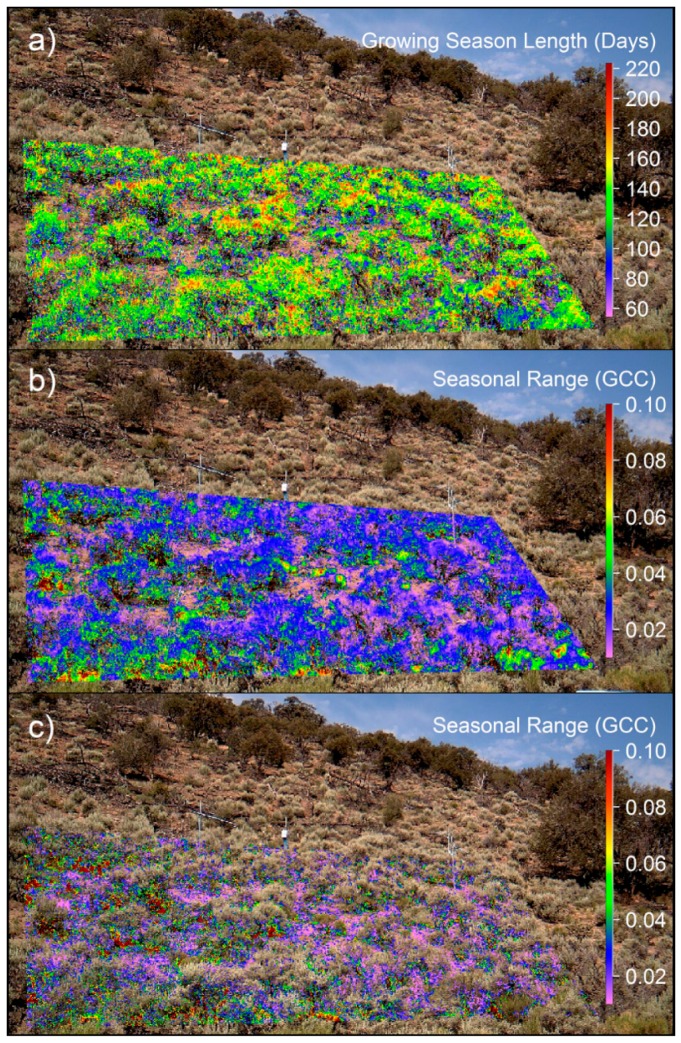
Figure 9.
(a) Growing season length (GSL) illustrated for pixels of vegetation, data are from the gray bars in Figure 8c; (b) Seasonal GCC range of vegetation, pixels of vegetation were determined from the gray bars in Figure 8c; (c) Seasonal GCC range of the interspace, interspace pixels were determined from red bars in Figure 8c. Interspace pixels were as follows: green to red match bark and shadows and violet to blue match bare ground. (b,c) scales were kept fixed from 0.01–0.1 to highlight the two distributions.

