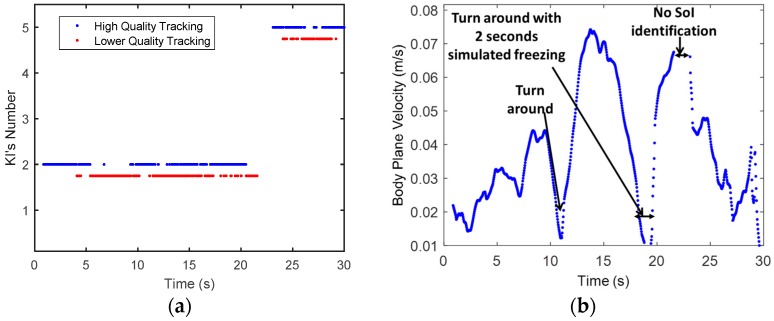
Figure 9.
The SoI’s gait experiment results. (a) Shows the SoI’s Quality of tracking (KSs’ 2 and 5), and (b) Shows the SoI’s Body plane (x-y) velocity over time. It is seen that there are continuous burst periods (5–10, 12–13, 20–22), the skeleton is distorted from its reference KS, and hence the tracking quality is low. These bursts correspond to the artifacts shown in Figure 5 of shadowing, merge of skeletons, and going in and out of the Kinect range; (b) shows the SoI’s ground plane velocity. The nulls in the plane velocity, fits the tagging of turn arounds as was derived from the Kinect video color image at around 11, and 18–20 s.

