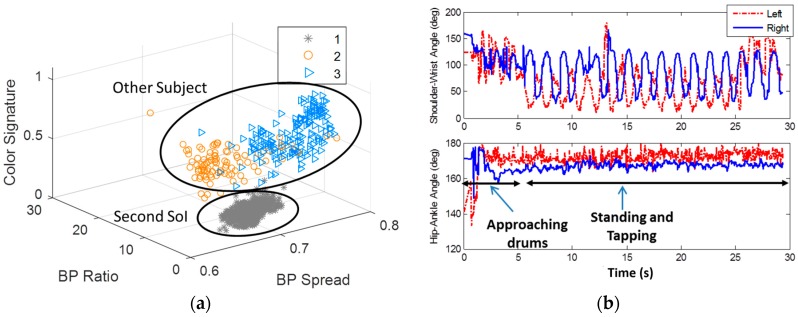
Figure 10.
Tapping experiment results. (a) shows the SoI of the first KI in the tapping experiment. Like in the gait experiment it is well separated in the feature space, and its tracking quality, due to its optimal range is high; (b) shows upper and lower limbs orientation over time in tapping experiment. The lower limbs indicate on approaching phase with two gait cycles of length of around 4 s, and then the tapping stage begins, with periodic upper limbs activity. The subject in background did not affect the estimations, due to the optimal SoI location, and the line of sight conditions.

