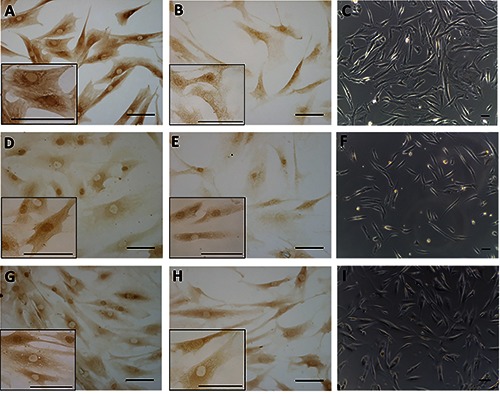
Figure 3.

ERα (A,D,G) and RXFP1 (B,E,H) receptor expression in fibroblasts isolated from three different fascial districts: the rectus sheath of the abdomen (A-C), the crural fascia of the leg (D-F), and the fascia lata of the thigh (G-I). Higher magnification images are shown in the insets. Bright-field images are shown in C,F,I. Scale bars: 100 μm.
