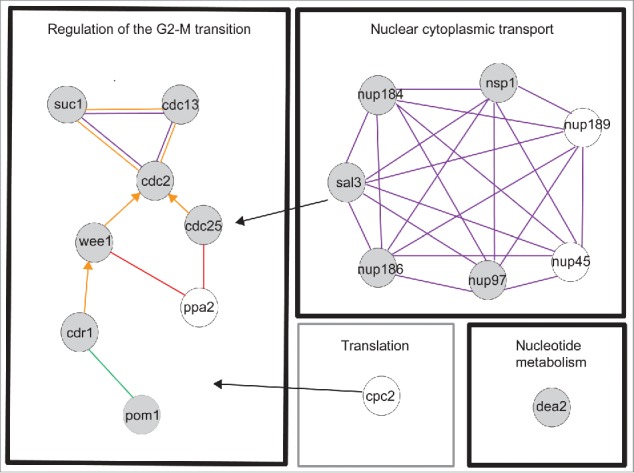
Figure 2.

Functional groups and physical interactions for the HI genes. Evidence codes are orange edge = physical interaction, purple edge = within complex interaction, green edge = within pathway interaction, arrowhead = directed edge ie modification of a gene product by itself or another gene product, red edge = genetic interaction. Black arrows indicate genes involved in processes associated with more than one functional module. Gray filled circle = 10% gene set, unfilled circle = 8% gene set. The physical interactions were determined by esyN using Pombase high confidence interactions. The black boxes are the functional groups for the 10% gene set, the gray box is an additional functional group for the 8% gene set. This gene is also related to Regulation of the G2-M transition.
