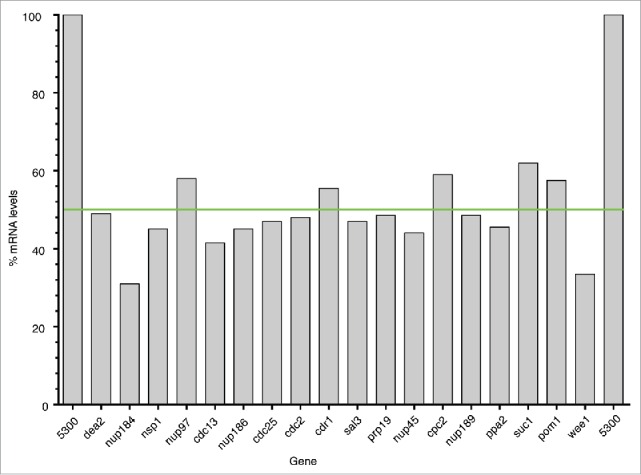
Figure 3.

mRNA expression levels for the HI gene set. Graph showing the mRNA expression level for each the HI gene in the heterozygous deletion diploid strain compared to the homozygous control strain (100%) normalized to act1 mRNA. The green line denotes 50% of the control mRNA level.
