
Figure 3. Brain magnetic resonance imaging of old untrained C57 and trained and untrained ApoE−/− mice .
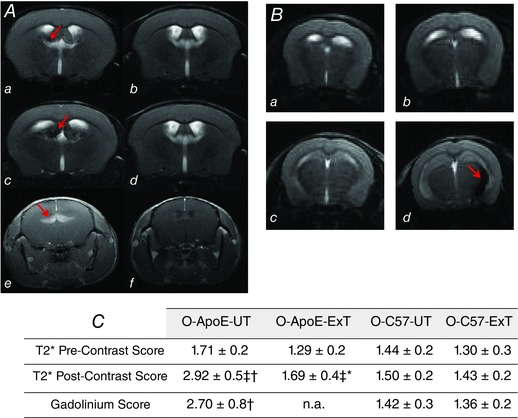
A, brain MRI in old untrained ApoE−/− (O‐ApoE‐UT, left panel) vs. old untrained C57 mice (O‐C57‐UT, right panels; pre‐USPIO T2 MRI, a and b; and 48 h post‐USPIO T2 MRI, c and d; post‐gadolinium T1 MRI, e and f). In O‐ApoE‐UT mice, red arrows indicate a hypointense region, suggesting inflammation, in a and c, and bright zone in e, suggesting BBB leakage. B, brain T2 MRI (pre‐USPIO, a and b; and 48h‐post‐USPIO, c and d) in untrained (O‐ApoE‐UT, left panels) vs. trained old ApoE−/− mice (O‐ApoE‐Ext, right panels) showing a hypointense region (red arrow in d) demonstrating inflammation in the left periventricular fornix fimbria in the O‐ApoE‐UT mouse, and a normal image in the O‐ApoE‐ExT (d). C, brain pre‐ and post‐USPIO T2* scores and post‐gadolinium T1 score for old sedentary and trained ApoE−/− mice (O‐ApoE‐UT and O‐ApoE‐ExT, respectively) and old sedentary and trained C57 mice (O‐C57‐UT and O‐C57‐ExT, respectively). *Significantly different (P < 0.05) O‐ApoE‐ExT vs. O‐ApoE‐UT. †Significantly different (P < 0.05) O‐C57‐UT vs. O‐ApoE‐UT. ‡Significantly different (P < 0.05) from pre‐contrast.