
Figure 4. Brain magnetic resonance images of an old untrained ApoE−/− mouse .
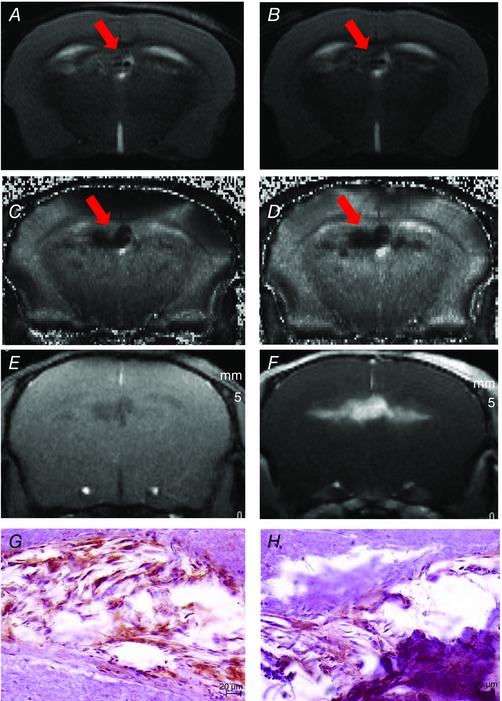
Pre‐ (A) and post‐USPIO (B) T2 images, both showing hyposignal and heterogeneous regions around the choroid plexus representative of vascular sequelae (A, arrow) and inflammation (B, arrow). Pre‐ (C) and post‐USPIO (D) T2* maps, with an increase of the hyposignal region on post‐USPIO, suggesting iron deposits (C, arrow) and phagocytic activity (D, arrow). Pre‐ (E) and post‐gadolinium (F) T1 images, the enhancing bright zone showing BBB leakage in the same area (F). G, positive F4/80 staining, confirming macrophages in this area. H, positive IgG staining in the same locations, confirming MRI findings of blood–brain barrier leakage.