Abstract
Chronic kidney disease (CKD) is a highly prevalent condition in the world. Neurological, psychological, and cognitive disorders, related to CKD, could contribute to the morbidity, mortality, and poor quality of life of these patients. The aim of this study was to assess the neurological, psychological, and cognitive imbalance in patients with CKD on conservative and replacement therapy.
Seventy-four clinically stable patients affected by CKD on conservative therapy, replacement therapy (hemodialysis (HD), peritoneal dialysis (PD)), or with kidney transplantation (KT) and 25 healthy controls (HC), matched for age and sex were enrolled. Clinical, laboratory, and instrumental examinations, as renal function, inflammation and mineral metabolism indexes, electroencephalogram (EEG), psychological (MMPI-2, Sat P), and cognitive tests (neuropsychological tests, NPZ5) were carried out.
The results showed a significant differences in the absolute and relative power of delta band and relative power of theta band of EEG (P = 0.008, P < 0.001, P = 0.051), a positive correlation between relative power of delta band and C-reactive protein (CRP) (P < 0.001) and a negative correlation between estimated glomerular filtration rate (eGFR) (P < 0.001) and 1,25-dihydroxyvitamin D3 (1,25-(OH)2D3) (P < 0.001), in all the samples. Qualitative analysis of EEG showed alterations of Grade 2 (according to Parsons–Smith classification) in patients on conservative therapy, and Grade 2–3 in KT patients. The scales of MMPI-2 hysteria and paranoia, are significantly correlated with creatinine, eGFR, serum nitrogen, CRP, 1,25-(OH)2D3, intact parathyroid hormone (iPTH), phosphorus, and cynical and hysterical personality, are correlated with higher relative power of delta (P = 0.016) and theta band (P = 0.016). Moreover, all NPZ5 scores showed a significant difference between the means of nephropathic patients and the means of the HC, and a positive correlation with eGFR, serum nitrogen, CRP, iPTH, and vitamin D.
In CKD patients, simple and noninvasive instruments, as EEG, and cognitive-psychological tests, should be performed and careful and constant monitoring of renal risk factors, probably involved in neuropsychological complications (inflammation, disorders of mineral metabolism, electrolyte disorders, etc.), should be carried out. Early identification and adequate therapy of neuropsychological, and cognitive disorders, might enable a better quality of life and a major compliance with a probable reduction in the healthcare costs.
Keywords: chronic kidney disease, hemodialysis, kidney transplantation, peritoneal dialysis, quality of life
1. Introduction
Chronic kidney disease (CKD) is a highly prevalent condition and its prevalence is growing in the world. Epidemiological data derived from cardiovascular risk in renal patients of the Health Examination Survey study (CARHES)[1] showed a prevalence of CKD in Italy of 7.5% for men and 6.5% for women, and the National Health and Nutrition Examination Survey III (NHANES III),[2] showed that CKD is estimated at about 10% of the world population. The CKD is a clinical condition that can progress to the end-stage renal disease, with high cardiovascular morbidity and mortality,[3] that is not fully explained by traditional risk factors, but partially explained by risk factors associated with CKD (mineral metabolism disorders, metabolic acidosis, endothelial dysfunction, inflammation, oxidative stress, etc.). Even the neurological complications related to CKD, greatly contribute to the morbidity, mortality, and poor quality of life of these patients. Neurological complications are characterized by cognitive impairment, anxiety, fatigue, apathy, clumsiness, irritability, sleep disturbances, and impaired concentration. Moreover the patient may become emotionally labile, more obviously forgetful and sluggish, make perceptual errors, and develop sleep inversion until sleep myoclonus. These patients may manifest, also, peripheral neuropathy, leading to weakness and disability, but currently these clinical manifestations are avoided by early replacement therapy.[4,5] Cognitive decline is significantly associated with CKD, regardless of age and other potential confounding factors.[6] Elias and Elias[7] and Kurella Tamura and Wadley[8] showed early appearance of global cognitive deficit in CKD, which progressively increases with worsening renal function, independently from other traditional risk factors. Furthermore, another fundamental aspect that has been considered in recent years is related to psychological problems, that may appear along with neurological and cognitive disorders and that significantly reduce the quality of life of these patients.
2. Aim of the study
The aim of this study was to assess the neurological, psychological, and cognitive disorders in patients with CKD (Stage 4/5 Kidney Disease Outcomes Quality Initiative (KDOQI)), in conservative and replacement therapy ((hemodialysis (HD), peritoneal dialysis (PD)), or with kidney transplantation (KT)) and the correlation with risk factors associated with renal disease.
3. Materials and methods
The study protocol was approved by the Clinical Research Ethics Committee of University Hospital “Policlinico Umberto I” of Rome, Sapienza University of Rome, Italy with protocol number 807/12. The study conforms to the principles outlined in the Declaration of Helsinki and we obtained a written consent from each patient before the enrollment.
3.1. Study design and subjects
We performed an observational study on 99 clinically stable patients, enrolled from December 2013 to March 2015, at the University Hospital “Policlinico Umberto I” of Rome, Sapienza University of Rome, Italy. The study included 22 patients with CKD on conservative therapy (eGFR ≤ 30 mL/min, stage 4/5 KDOQI), 15 patients on HD, 16 patients on PD, 21 patients with KT (from at least 36 months with eGFR ≥60 mL/min, in the absence of acute renal failure, without proteinuria or renal infections), and 25 healthy controls (HC) matched for age and sex. Statins, antihypertensive, antiplatelet therapies, and/or therapies with calcium, calcitriol, and phosphate binders were continued in all patients included in the study. We excluded patients with heart failure, liver insufficiency, chronic obstructive pulmonary disease, cerebrovascular disease, degenerative neurological or psychiatric diseases, acute myocardial infarction, and acute coronary syndrome within 3 months before the study. Patients who refused to give consent and patients with missing data were not enrolled. eGFR was calculated with the abbreviated Modification of Diet in Renal Disease (MDRD) formula, as defined by Levey et al.[9] Clinical, laboratory, and instrumental examinations, and neuropsychological tests were carried out. Clinical and instrumental examinations of HD patients were performed during the middle of the week, after HD treatment, while PD patients were examined before the first replacement of the morning with an empty peritoneum at routine visits.[10]
3.2. Anthropometric assessments
Body weight was determined to the nearest 0.1 kg using a calibrated digital scale. Body mass index (BMI) was calculated by the formula: [weight (kg)/height (m2)].
3.3. Laboratory measurements
Blood was drawn in the morning after an overnight fast of at least 12 hours. In all patients, the levels of fasting plasma glucose (mg/dL), total serum cholesterol (mg/dL), triglycerides (mg/dL), high-density lipoprotein (HDL) (mg/dL), serum creatinine (mg/dL), hemoglobin (g/dL), nitrogen (mg/dL), serum uric acid (mg/dL), serum calcium (mg/dL), phosphate (mg/dL), serum electrolytes (mEq/L), C-reactive protein (CRP) (mg/L), and erythrocyte sedimentation velocity (ESV) (mm/H) were measured using standard automated techniques. Serum albumin (g/dL) was determined by bromocresol purple method. Parathormone (pg/mL) was measured using a 2-site assay that measures “intact” hormone (iPTH). 1,25-Dihydroxyvitamin D3 (1,25-(OH)2D3) (ng/mL) was measured by radioimmunoassay. Low-density lipoprotein (LDL)-cholesterol (mg/dL) was calculated using the Friedewald equation: LDL = total cholesterol − HDL − (triglycerides/5). We have evaluated routine and microscopy urinalysis and albuminuria in 24-hour urine in KT patients and calculated urea-based dialysis adequacy Kt/V (K, dialyzer clearance of urea, t, dialysis time, V, volume of distribution of urea), in particular weekly standard Kt/V (sdtKt/V) in dialysis patients.[11,12] We have also assessed plasma ammonia, hemogasanalysis, and plasma concentration of immunosuppressive drugs to exclude other forms of metabolic encephalopathy or brain damage related to drug toxicity according to standard outpatient protocols. Plasma ammonia was performed using venous blood samples with ethylene diamine tetraacetic acid and to maintain the cold chain, samples were quickly delivered to the laboratory on ice. Plasma ammonia was measured by an enzymatic method using glutamate dehydrogenase (Ammonia NH3L Cobas, Roche Diagnostics, Inc., Tokyo, Japan). Hemogasanalysis was performed using a blood gas analyzer (Nova Phox Plus C, Bollate (MI), Italy).
3.4. Blood pressure measurements
Clinic blood pressure measurements were made three times after 10 minutes of rest in a seated position using a standard automatic devices and cuffs adapted to the arm circumference according to the British Hypertension Society guidelines and the mean values for systolic blood pressure and diastolic blood pressure were calculated for all participants.[13] Systolic and diastolic blood pressure levels were measured at the routine visits with empty abdomen, in patients on PD and in HD patients before and after dialysis session.[10,14] The systolic and diastolic BP levels were taken as the points of appearance and disappearance of Korotkoff sounds, respectively. Hypertension was defined by elevated SBP (>140 mm Hg), DBP (>90 mm Hg).
3.5. Electroencephalogram (EEG)
Electroencephalogram (EEG) recordings were performed by a digital apparatus (Micromed, Treviso, Italy) and sampled at a rate of 256/second. According to the International 10-20 System,[15] the following scalp electrodes were applied: Fp2, Fp1, F8, F7, F4, F3, C4, C3, T4, T3, P4, P3, O2, and O1. Baseline EEG tracings were recorded for 20 minutes, with eyes closed. Tracings of patients and control subjects were blindly inspected offline by 2 neurophysiologists who assessed the general organization of the EEG background activity and the prevalence and type of abnormalities. The severity of EEG changes was classified according to a modification of the Parson–Smith qualitative classification as: Grade 1 (normal EEG), Grade 2 (distinctive features of encephalopathy), and Grade 3 (signs of severe encephalopathy).[16] For the quantitative analysis, 20 artifact-free epochs each lasting 4 seconds, were randomly selected from each baseline recording. According to a procedure described elsewhere[16,17] on these tracing epochs and from the mean values of all electrodes, the absolute (microV2) and relative (%) power in the various frequency bands (delta = 1–3.5 Hz, theta = 4–7.5 Hz, alpha = 8–12.5 Hz, beta1 = 13–19.5 Hz, and beta2 = 20–29 Hz) were calculated.[18] Main dominant frequency and median frequency were also calculated.
3.6. Neurological, psychological, and cognitive tests
All individuals completed a standardized battery of neuropsychological tests:
3.6.1. Minnesota multiphasic personality inventory (MMPI-2)
The Minnesota multiphasic personality inventory-2 (MMPI-2): a standardized psychometric test of adult personality and psychopathology. MMPI-2 consists of 567 items. MMPI-2 includes 8 validity, 10 clinical, 16 additional, and 15 content scales and each scale has several subscales (31 total). MMPI-2 operates with a value of ≥65 indicating an elevated score. This cut-off score indicates distinct psychological problems or pathology. MMPI-2 has been translated into Italian and it has been thoroughly tested and adapted.[19]
3.6.2. Satisfaction profile (SAT-P)
It is a test that provides both qualitative and quantitative self-satisfaction assessment within the health-related quality of life; the SAT-P is a self-report scale widely used in the healthcare context. The scale defines satisfaction as the result of a cognitive process that compares real with ideal expectations. Level of satisfaction is linked to the gap between real and ideal expectations. The SAT-P assesses subjective satisfaction in the preceding month using 5 macrocategories: Factor I (psychological functioning), Factor II (physical functioning), Factor III (work), Factor IV (sleep/diet/free time), and Factor V (social functioning). The questionnaire consists of 32 items, measured on a visual analog scale: the level of agreement with a statement is indicated by marking a position along a continuous line (10 cm) between 2 end-points (totally satisfied/totally dissatisfied).[20] The score range is 0 to 100, 0 = total dissatisfaction and 100 complete satisfaction.
3.6.3. Neuropsychological test (NPZ5)
Neurocognitive testing was administered by a designated investigator at each study site who had completed standardized training to administer the test procedures. Five domains were assessed as follows:
Rey auditory verbal learning test (RAVL) (List A and List B) evaluates different functions: short-term auditory-verbal memory, rate of learning, learning strategies, retroactive and proactive interference, presence of confabulation of confusion in memory processes, retention of information, and differences between learning and retrieval.
Trail-making test (TMT) (Parts A and B) is a neurocognitive test of visual attention and change task used in clinical settings for the evaluation of cognitive deficits.
Digit span test (DST) (forward and backward) is used to measure working memory's number storage capacity.
Symbol digit modalities test (SDMT) (90 and 120 seconds) is widely used because it is easy to administer, reliable, and evaluates information processing speed, including attention and visual scanning.
Grooved Pegboard Test (GPT) (with dominant hand and with nondominant hand) is a manipulative dexterity test and it requires complete visual and motor coordination.[21]
3.7. Statistical analysis
Data management and analysis were performed using IBM SPSS Statistics 17 for Windows software and a probability value of P < 0.05 was considered to be statistically significant. All continuous variables that follow a normal distribution were expressed as mean (±standard deviation), and not normal variables were expressed as median (IQR). Categorical variables were expressed as number (percentage). Student t test or the Mann–Whitney U test (two-tailed) or ANOVA were performed to determine the differences between groups. The Chi-square test was used to compare categorical variables. The Spearman or Pearson correlation was used to determine the correlation bivariate relationship and the strength of association between variables. The groups were compared using Chi-square test, Kruskal–Wallis test, or analysis of variance. Variance inflation factor (VIF) was used to quantified the severity of multicollinearity in an ordinary least squares regression analysis. No problem of multicollinearity was identified.
4. Results
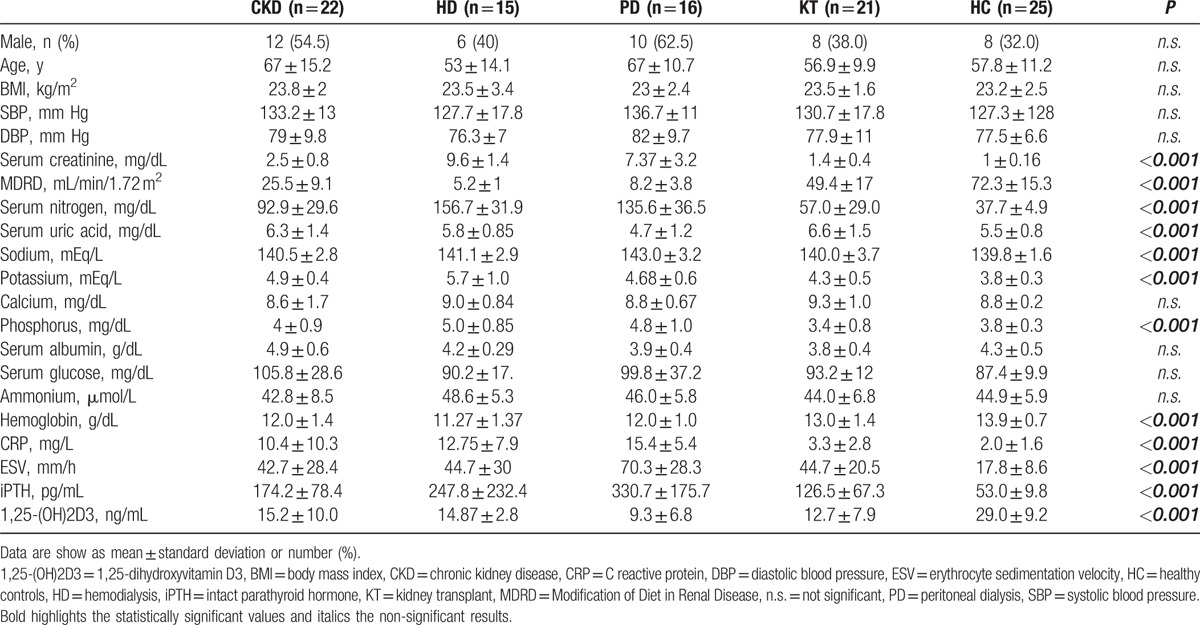
Table 1 shows the patient's characteristics. In summary, there were no significant differences between the groups, except for values of creatinine (mg/dL) (P < 0.001), MDRD (mL/min) (P < 0.001), serum nitrogen (mg/dL) (P < 0.001), uric acid (mg/dL) (P < 0.001), potassium (mEq/L) (P < 0.001), phosphorus (mEq/L) (P < 0.001), hemoglobin (g/L) (P < 0.001), CRP (mg/L) (P < 0.001), ESV (mm/H) (P < 0.001), iPTH (pg/mL) (P < 0.001), 1,25-(OH)2D3 (ng/mL) (P < 0.001) (Table 1). The patients were receiving adequate dose of dialysis, as measured by weekly standard Kt/V (sdtKt/V), that was >2 in all dialysis patients. The dosage of immunosuppressive therapy in patients with KT was in the therapeutic range in all patients (data not shown).
Table 1.
Patients’ characteristics.
4.1. EEG analysis
The quantitative analysis of EEG data, showed a significant difference, between CKD patients and HC, of the relative and absolute power of delta band (P < 0.001, P = 0.008) (Table 2), more evident in PD patients (Fig. 1), of the relative power of theta band (P = 0.051), more evident in HD patients (P = 0.019) and of the relative and absolute power of Beta1 band (P = 0.012, P = 0.022) (Table 2). The qualitative analysis of EEG data, showed more regular and stable EEG, on conservative therapy and KT patients, (most represented Grade 1 scale Parsons–Smith) (Fig. 2), respect to HD and PD patients (greater Grade 2 and 3 scale Parsons–Smith). However, also in conservative therapy patients, EEG showed a lower percentage of Grade 2 and even Grade 3 on KT patients, respect to HC (Fig. 2). Bivariate analysis showed a negative correlation between relative power of delta band and 1,25-(OH)2D3 (Fig. 3), MDRD value (Fig. 4), and the TMT of NPZ5 score (r = 0.235, P = 0.043), and a positive correlation with CRP value (Fig. 5) and ESV (r = 0.418, P < 0.001) in all the samples.
Table 2.
Quantitative analysis of EEG data.

Figure 1.
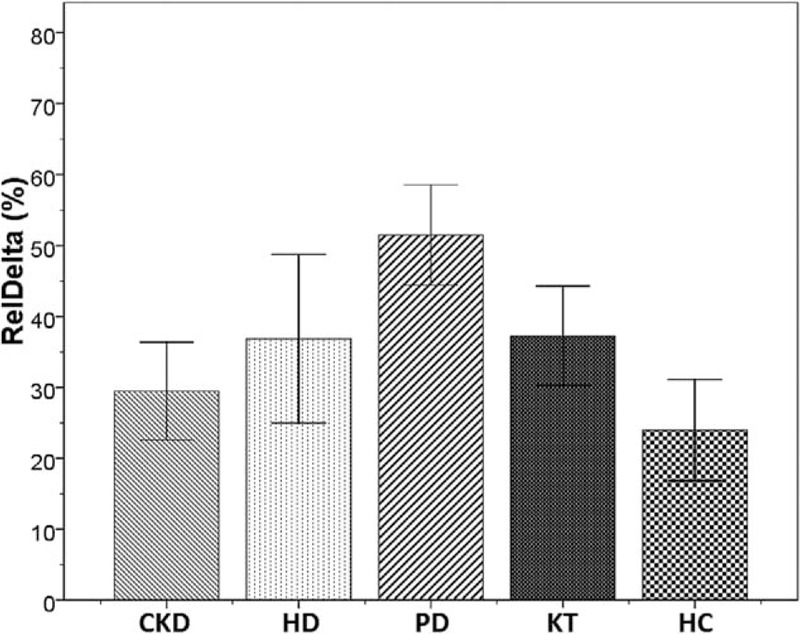
Bar charts with error bars. The mean value of relative power of delta band (%) was significantly higher in patients on peritoneal dialysis (PD), compared with control group (51.5 ± 12.3 vs 23.9 ± 14.3, ∗P < 0.001). Boxes represent means; error bars indicate the 95% of CI (confidence interval). CKD = chronic kidney disease, HC = healthy controls, HD = hemodialysis, KT = kidney transplantation, PD = peritoneal dialysis, RelDelta = relative power of delta band.
Figure 2.
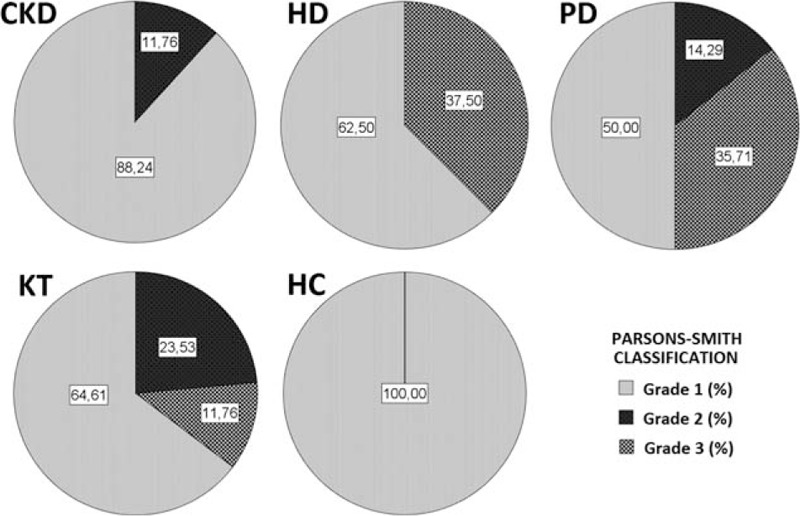
EEG visual analysys classification according to the Parsons–Smith grading. Grade 1: normal EEG, Grade 2: distinctive features of encephalopathy, Grade 3: signs of severe encephalopathy. CKD = chronic kidney disease, HC = healthy controls, HD = hemodialysis, KT = kidney transplantation, PD = peritoneal dialysis.
Figure 3.
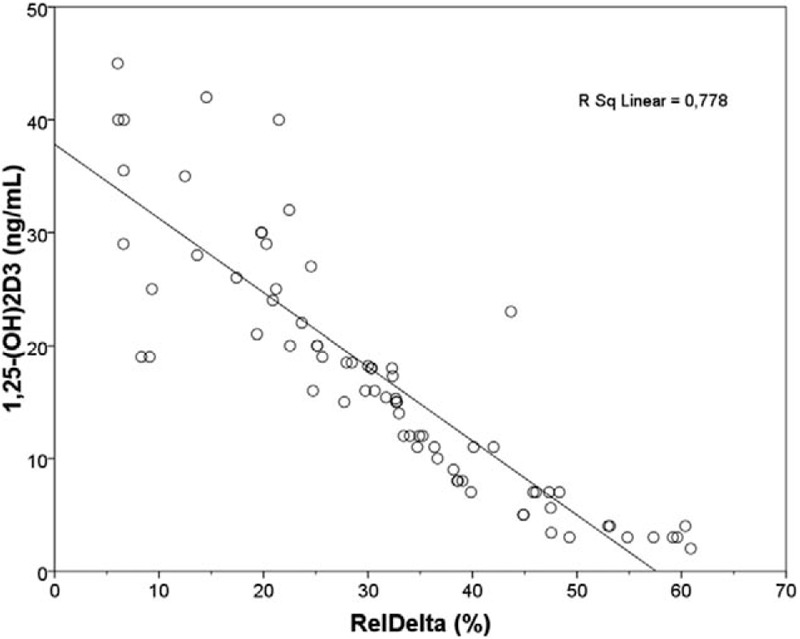
Linear regression plot. 1,25-(OH)2D3 (ng/mL) vs RelDelta (%) in overall population. Negative correlation was found between the 2 parameters (r = −0.820, P < 0.001). 1,25-(OH)2D3 = 1,25-dihydroxyvitamin D3 ng/mL, RelDelta = relative power of delta band.
Figure 4.
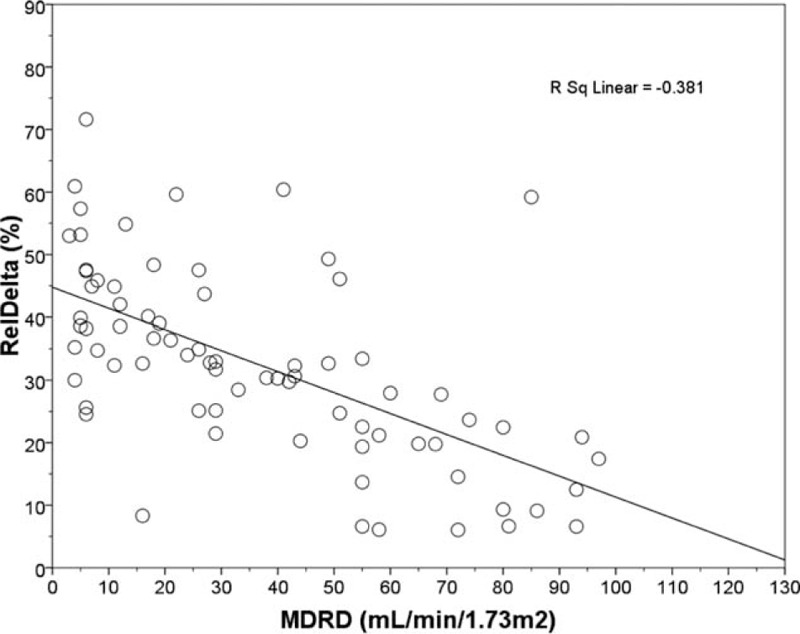
Linear regression plot. RelDelta (%) vs MDRD (mL/min/1.73 m2) in overall population. Negative correlation was found between the 2 parameters (r = −0.617, P < 0.001). MDRD = Modification Diet of Renal disease, RelDelta = relative power of delta band.
Figure 5.
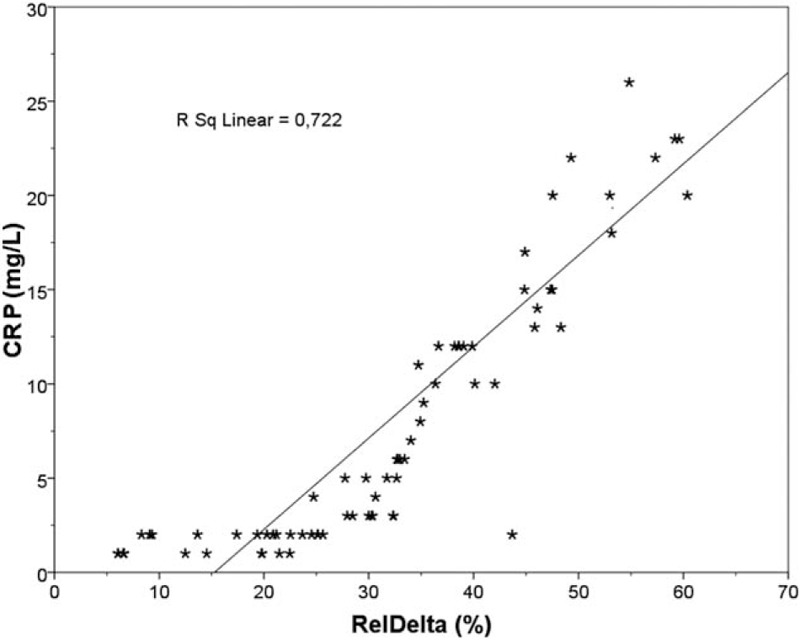
Linear regression plot. CRP (mg/L) vs RelDelta (%) in overall population. Positive correlation was found between the 2 parameters (r = 0.850, P < 0.001). CRP = C reactive protein, RelDelta = relative power of delta band.
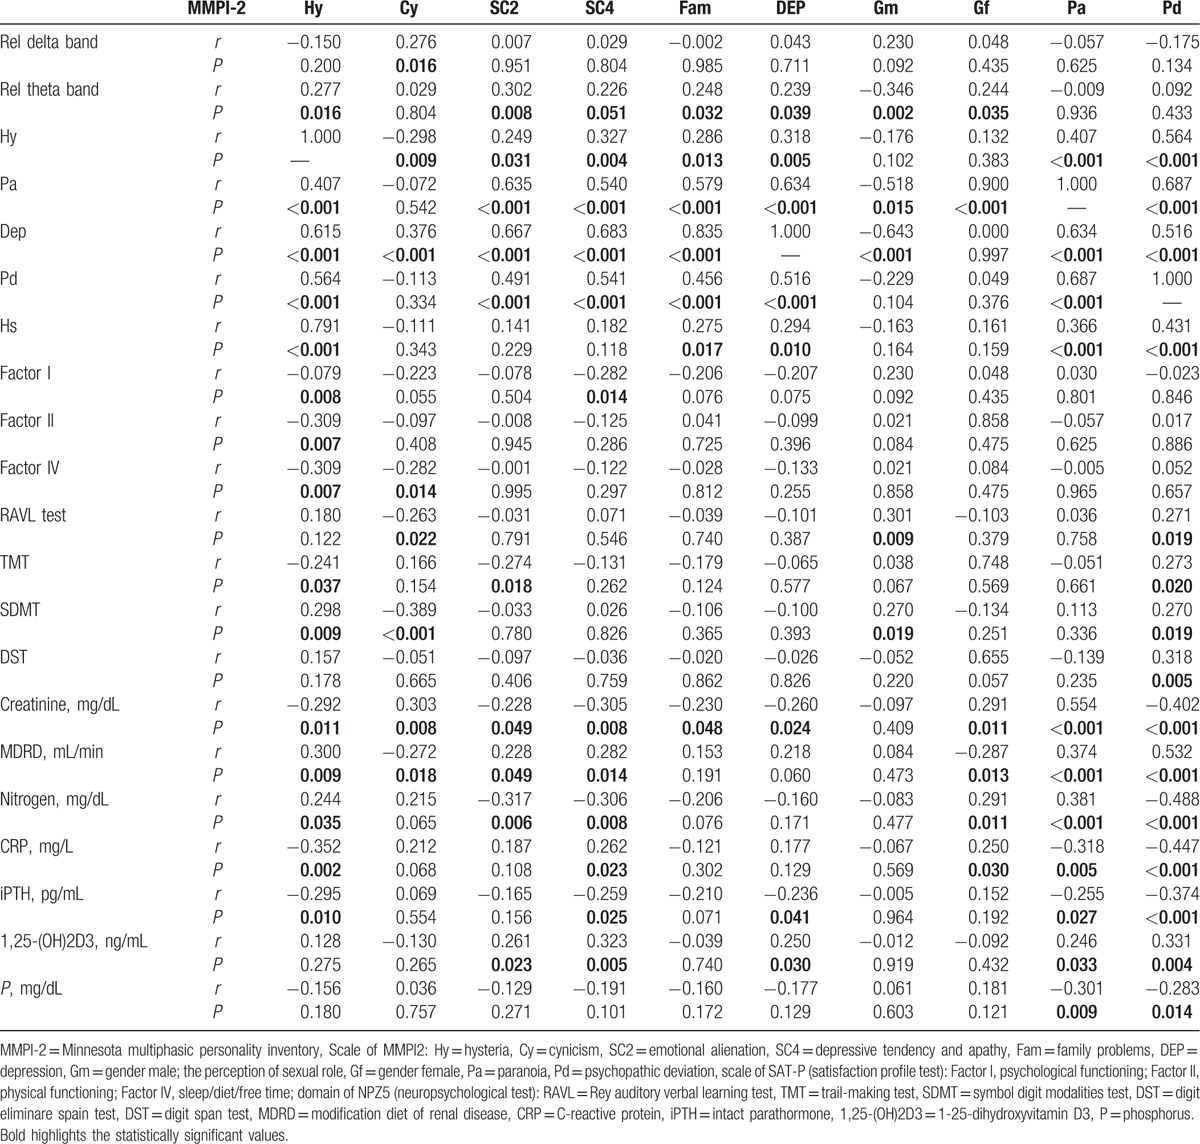
EEG and MMPI-2 data analysis have showed that higher relative power of delta band, positively correlates with the content scale, Cyn (cynicism) (r = 0.276, P = 0.016) (Table 3), and an increased relative power of theta band, positively correlated with Hy (hysteria) (r = 0.277, P = 0.016), SC2 (emotional alienation) (r = 0.302, P = 0.008), SC4 (depressive tendency and apathy) (r = 0.226, P = 0.051), Fam (family problems) (r = 0.248, P = 0.032), D (depression) (r = 0.239, P = 0.039), and Gf (gender female; the perception of sexual role; r = −0.346, P = 0.035), while negatively correlated with Gm (gender male; r = 0.244, P = 0.002) (Table 3).
Table 3.
Bivariate correlation between EEG (relative power of delta and theta band), MMPI-2 scale, Sat P, NPZ5 and renal function, mineral metabolism and inflammation markers.
4.2. MMPI-2, SAT-P, and NPZ5 test analysis
Analysis of variance of MMPI-2, showed a difference between CKD patients and HC, in all baseline clinical scale D (depression) (Fig. 6), in particular, the HD and PD groups showed a significant difference of averages when compared with HC (P < 0.001, P < 0.001) (Fig. 6). The scale Hy of MMPI-2 showed a positive correlation with Pa (paranoia) (r = 0.407, P < 0.001), D (r = 0.615, P < 0.001), Pd (psychopathic deviate) (r = 0.56, P < 0.001) scales, and with hypochondria (r = 0.791, P < 0.001) (Table 3). Moreover, Hy scale showed a positive correlation with Factor I (psychological functioning), Factor II (physical functioning), and Factor IV (sleep/diet/free time) (r = −0.079, P = 0.008, r = −0.309, P = 0.007, r = −0.309 P = 0.007, respectively) of SAT-P and with TMT (r = −0.241, P = 0.037) and SDMT (r = 0.298, P = 0.009) of NPZ5 score, as well as with creatinine, MDRD, serum nitrogen, CRP, and iPTH (r = −0.292, P = 0.011; r = 0.300, P = 0.009; r = 0.244, P = 0.035; r = −0.352, P = 0.002; r = −0.295, P = 0.010, respectively) (Table 3). The scales Pa of MMPI-2 showed a significant correlation with creatinine, MDRD, serum nitrogen, CRP, 1,25-(OH)2D3, iPTH, phosphorus (r = 0.554, P < 0.001; r = 0.374, P = 0.001; r = 0.381, P = 0.001; r = −0.318, P = 0.005; r = −0.255, P = 0.027; r = 0.246, P = 0.033; r = −0.301, P = 0.009, respectively), such as the scale Pd (psychopathic deviate) (r = −0.402, P < 0.001; r = 0.532, P < 0.001; r = −0.488, P < 0.001; r = −0.447, P < 0.001; r = −0.374, P < 0.001; r = 0.331, P = 0.004; r = −0.283, P = 0.014, respectively). The scale Pd of MMPI-2, showed also a significant correlation with RAVL, DST, SDMT, and TMT tests, of NPZ5 score (r = 0.271, P = 0.019; r = 0.270, P = 0.019; r = 0.318, P = 0.005; r = −0.283, P = 0.014, respectively) (Table 3), while the TRT (negative treatment indicators), an alternative scale of MMPI-2, that indicate negative attitudes of the subject towards health treatments, showed a negative correlation with factor IV of SAT-P (r = −327, P = 0.004), that indicate sleep/diet/free time and with SDMT (90–120 seconds) of NPZ5 (r = −304, P = 0.008; r = −0.311, P = 0.007), that assesses attention, visual scanning, and information processing speed (data not shown). Moreover, the subscale D2 (psychomotor retardation) showed a positive correlation with DST and SDMT (r = 0.289, P = 0.12; r = 0.262, P = 0.23, respectively) of NPZ5. At last, all NPZ5 scores showed a significant difference between the means of nephropathic patients and the means of the HC (Fig. 7), and a positive correlation with MDRD, serum nitrogen, CRP, ESV, iPTH, and 1,25-(OH)2D3 (Table 4).
Figure 6.
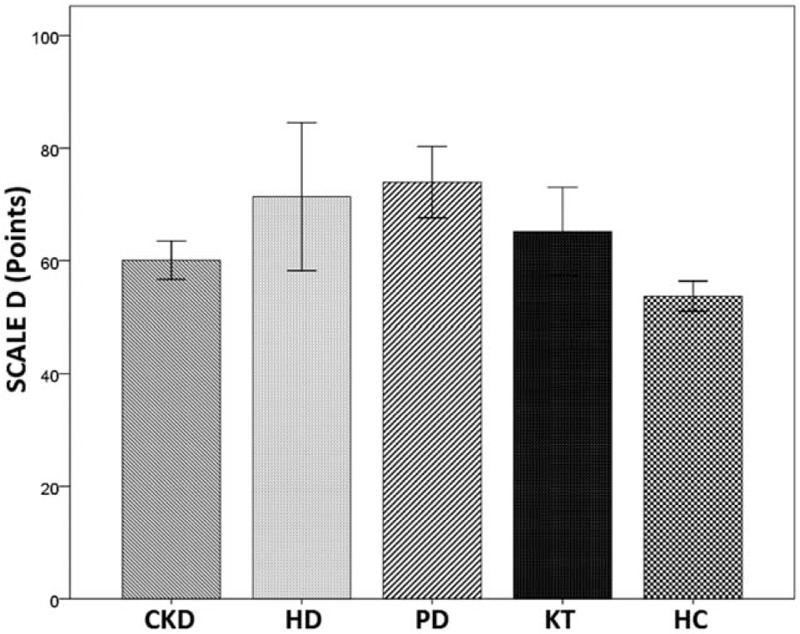
Bar charts with error bars. The mean value of clinical Scale D (points) was significantly higher in HD and PD patients compared with HC (71.4 ± 15.7, 73.9 ± 11.0 vs 53.7 ± 5.4; P < 0.001, P < 0.001, respectively). Boxes represent means; error bars indicate the 95% of CI. CI = confidence interval, CKD = chronic kidney disease, D = depression, HC = healthy controls, HD = hemodialysis, KT = kidney transplantation, PD = peritoneal dialysis.
Figure 7.
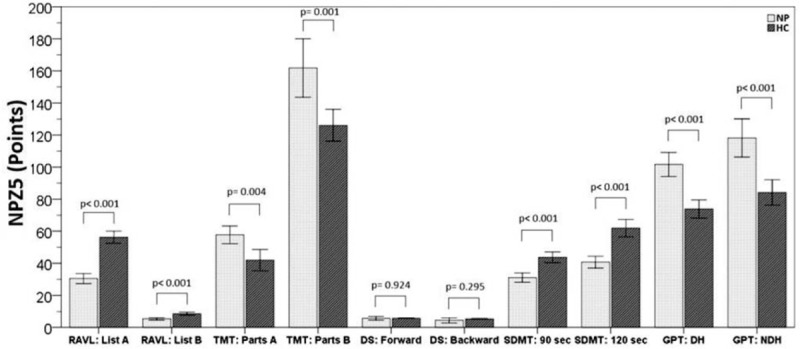
Bar charts with error bars. NPZ5 (points) test results in nephropathic patients compared with healthy controls. Boxes represent means; error bars indicate the 95% confidence interval. DST = digit span test, GPT: DH = Grooved Pegboard Test dominant hand, GPT: NDH = Grooved Pegboard Test nondominant hand, HC = healthy controls, NP = nephropathic patients, NPZ5 = neuropsychologic z score for 5 tests, RAVL = Rey Auditory Verbal Learning test, SDMT = symbol digit modalities test, TMT = trail making test.
Table 4.
Bivariate correlation between NPZ5 test score and others variables in overall population.
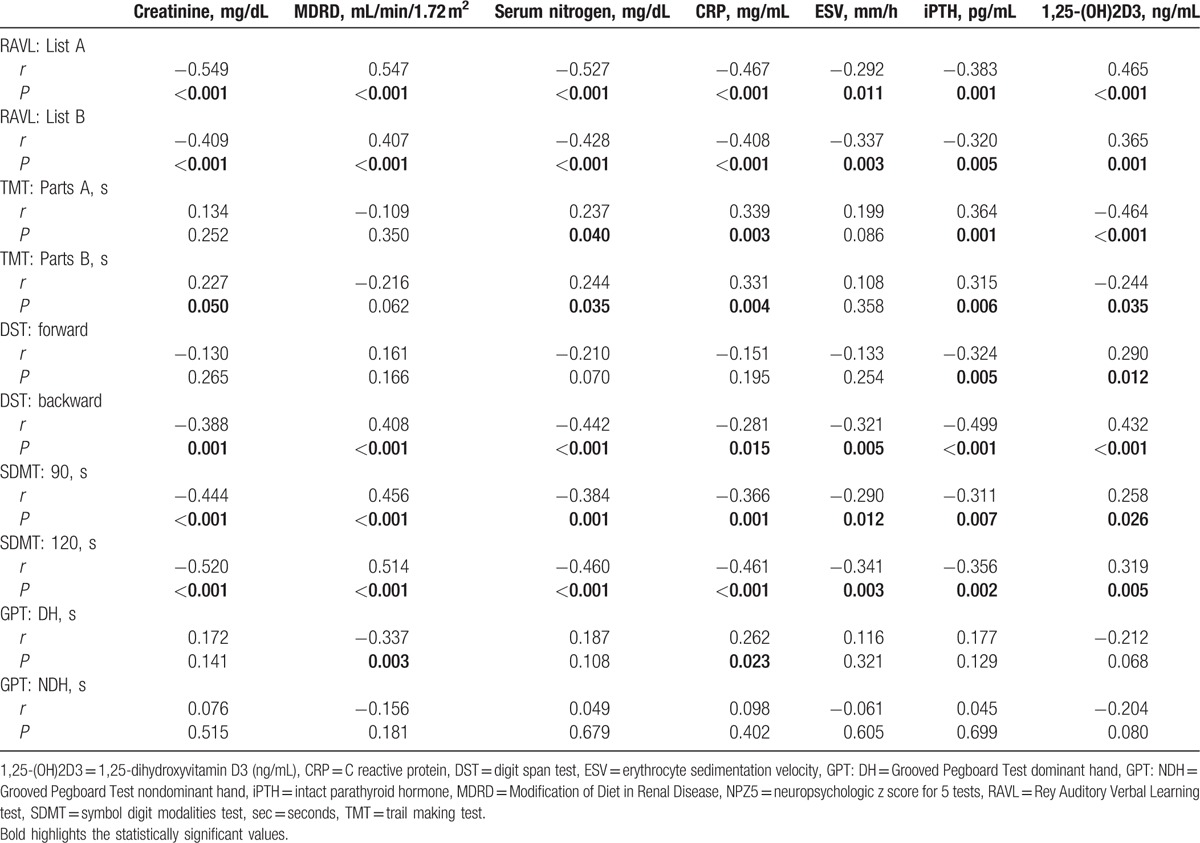
Table 5 shows SAT-P analysis and significant difference between CKD patients and HC. PD patients showed the highest level of satisfaction, while both patients, on conservative therapy and with KT, showed significant differences compared to HC in more domains of the test (Table 5).
Table 5.
Satisfaction profile analysis and comparison with healthy controls.

5. Discussion
The neurological, psychological, and cognitive complications related to CKD, could contribute to the morbidity, and poor quality of life of these patients, but the prevalence, the pathogenesis, and the eventual therapy, remain currently unknown. The neurologic complications are better detected by neurophysiological techniques rather than through the neuroimages[4]; in fact, the EEG is very sensitive to the action of metabolic imbalances and toxic factors. In our study, the quantitative analysis of EEG data, showed a significant difference, between CKD patients and HC, of the relative and absolute power of delta, theta, and Beta1 band (Table 2). Delta waves are usually associated with the deep stage 3, of nonrapid eye movement sleep, or in early developmental stages. Increase in delta power has been associated with autonomic and metabolic processes, suggesting that it may be involved in the integration of cerebral activity with homeostatic processes; in fact, it was found increased in metabolic diseases, intoxication, and uremic encephalopathy. The theta rhythm is dominant in the infant, and may represent emotional tensions, it should not be present in physiological conditions, in the waking state in adulthood, but may appear in general anesthesia and in some brain diseases, or in general metabolic diseases, such as uremic encephalopathy. Beta waves are dominant in the waking state, but also in alert state and in rapid eye movement sleep. Also the qualitative analysis of EEG, showed some differences, with a more regular and stable EEG, on conservative therapy and KT patients, respect to dialysis patients. Therefore, renal replacement therapy, could not be able to completely remove the possible substances involved in the pathogenesis of neurological disorders, without difference between PD and HD, as previously reported by Burn and Bates in 1998.[4] However, also in conservative therapy patients, EEG showed a lower percentage of Grade 2 and even Grade 3 on KT patients, respect to HC (Fig. 2). Therefore, KT, certainly remains the best therapeutic option, nevertheless, neurological disturbances could persist, even 3 years after transplant. Moreover, our study showed, a positive correlation between the relative power of delta band and reduced eGFR (Fig. 4), which could indicate an initial alteration in patients with CKD stage 4 KDOQI, as previously reported by Elias and Elias[7] and Kurella Tamura and Wadley[8]. The mechanisms of central nervous system dysfunction in CKD are multifactorial and only partially characterized; in fact, it has long been exclusively attributed to the increase in the serum concentration of urea, whereas the literature is considering other possible pathogenic mechanisms. Several guanidino compounds (GCs) could play an important role, indeed, 4 GCs (creatinine, guanidine, guanidinosuccinic acid, and methylguanidine), appeared to be highly increased in serum, brain, and cerebrospinal fluid of patients with CKD, and all were shown to be experimental convulsants in brain concentrations similar to those found in uremic brain. De Deyn et al[22] have described possible excitatory effects of uremic GCs on the central nervous system by the activation of N-methyl-d-aspartate receptors by guanidinosuccinic acid, and a concomitant inhibition of GABAA receptors by uremic GCs. Furthermore, a multitude of potential uremic toxins, including the nitric oxide synthase, modulating GCs, a decreased brain energy demand, some free amino acid changes, blood–brain barrier derangement and vascular disease, have been implicated in neurologic complications of CKD.[23] In addition to these mechanisms, some studies seem to indicate that neuropsychological alterations, could be, at least in part, due to inflammatory mechanisms, involving soluble and cellular mediators.[24] Our study confirmed a significant difference, between CKD patients and HC, in CRP and ESV values (Table 1) and it also showed, a positive correlation between relative power of delta band, and CRP (Fig. 5) and ESV, and between NPZ5 scores and CRP and ESV (Table 4). Moreover, many alterations of the central nervous system in CKD, could be mediated by secondary hyperparathyroidism,[25] indeed parathyroidectomy of animals with CKD, prevented the increase in basal levels of intracellular calcium, and disorders in neurotransmitter metabolism.[26,27] In our study, we have found a significant difference, between CKD patients and HC, in iPTH and 1,25-(OH)2D3 values (Table 1) and a negative correlation between 1,25-(OH)2D3 and relative power of delta band (Fig. 3). A variety of studies found an association between a low level of vitamin D and a high depression score.[28,29] Vitamin D deficiency was also associated with prominent changes in behavior and brain neurochemistry in the adult mouse.[30] The brain has a VDR (vitamin D receptors) and has the ability to produce vitamin D, which seems to have a neuroprotective role, inducing remyelination by endogenous progenitor cells.[31] Driessen et al[25] showed that patients with depressive disorders and CKD, presented a higher level of iPTH when compared with nondepressed subjects; thus, secondary hyperparathyroidism could be related to depressive symptoms. Anglin et al[32] have analyzed more than 30,000 individuals, finding a clear correlation between vitamin D deficiency and a higher rate of depression. Furthermore, Mozaffari-Khosravi et al[33] showed that a dose of 300,000 IU of vitamin D has been able to improve the state of depression in a statistically significant way, as reported by a recent review of Hoffman et al.[34] In our study, MMPI-2 analysis, showed a difference between CKD patients and HC, in all baseline clinical scale D (depression), already present in conservative therapy and not completely disappear in KT patients, even if, only HD and PD patients, showed a significant difference respect to HC (Fig. 6). Lack of vitamin D has a high prevalence in patients with renal disease in which the traditional causes of deficits (lack of sunlight exposure, reduced dietary intake), combine with those of the CKD (reduced synthesis in the skin, urinary loss of vitamin D, and vitamin D binding protein (DBP), loss of renal mass and function with reduced activity of 1α-hydroxylase, increased FGF-23). The decreased activation of vitamin D is reflected in proportional increases in circulating levels of iPTH, due in part to the decrease in intestinal absorption of calcium, and thus to the reduction of Ca ionized circulating, in part to the absence of the negative feedback directly exercised by vitamin D on the VDR on parathyroid.[4,35] Others potential risk factors, could be the anemia, as reported in other studies[36] and confirmed in our study, with a significant difference of hemoglobin value (Table 1), and the hyperuricemia (Table 1), possible endothelial dysfunction index.[37] These alterations, could, at least partially, contribute to explain the early neuropsychological and cognitive decline in CKD, still poorly known.[38] In our study, the MMPI-2 scales, Hy and Pa, are significantly correlated with creatinine, MDRD, serum nitrogen, CRP, 1,25-(OH)2D3, iPTH, phosphorus; moreover Hy and cyn are correlated with higher relative power of theta and delta band (Table 3). Moreover, Pd scale showed a significant correlation with Pa, Hy, depression scales, and all tests of NPZ5 score, but a negative correlation with creatinine, serum nitrogen, CRP, iPTH, and phosphorus, and a positive correlation with MDRD, 1,25-(OH)2D3, indicating a low Pd in CKD. Pd indicates the lack of control on emotional responses and the ability to internalize the social rules and low value, could be overly conventional and conforming, passive, and noncompetitive. The cyn scale of MMPI-2, suggests a hostile and suspicious personality. The Hy scale of MMPI2 indicates a tendency to somatize some emotions and psychological discomforts with anxiety, tension, and depression. In our study, Hy is associated with Pa, which may lead to poor compliance, to difficulties in communicating emotional problems and in establishing a relationship with the therapists, in addition to depression with unhappy, feeling weak, fatigued, and lacking energy. Moreover, Hy and Cyn scales are associated with Factor I (psychological functioning), Factor II (physical functioning), and Factor IV (sleep/diet/free time) (Table 3) of Sat P-test, showing a considerable psychological distress even in activities of daily living, and with several tests of NPZ5 score, that indicate cognitive disorders of attention, memory, motor, and manual coordination. Moreover, all NPZ5 scores showed a statistically significant difference between the means of nephropathic patients and the means of the HC (Fig. 7), and a positive correlation with MDRD, serum nitrogen, CRP, iPTH, and 1,25-(OH)2D3 (Table 4) showing a possible and early, cognitive deficit in CKD patients on conservative therapy, and a noncomplete recovery in KT patients, also after 3 years from transplantation, associated with psychological disorders, that could jeopardize the quality of family, work, and social life.[39] The start of dialysis is an important change in a person's life and determine stress for the permanently and continuously commitment and the many physical difficulties related to treatment, as well as the discomfort caused by dietary and fluid intake restrictions.[40] These aspects not only affect the personal habits but also the social and family relationships, modifying and/or resizing the patient's role in the family and at work. The main causes of psychological distress in CKD patients could be, the fear of death, but especially the condition of dependence from healthcare, dialysis machine, transplanted organ and/or family, which could be associated with anxious and/or depression disorders. In the past, treating the psychological, relational, and behavioral aspects of dialysis patients was considered “secondary” to the need to keep the patient alive. Currently, dialysis patients have an important alternative to resignation, in fact, through multidisciplinary interventions (nephrological, neurological, and psychological), is possible reach advanced levels of adaptation, maintain good compliance, with effective control of fluid intake and of weight gain interdialytic, promoting significant improvements in the quality of life and survival, enabling a significant reduction in the healthcare costs worldwide.[39,40]
5.1. Limitations of the study
This study is a pivotal study, conducted in relatively small cohort of CKD patients; therefore, a larger population is requested to confirm our results. Also, all patients were on therapies with calcium, calcitriol, and phosphate binders and their treatments could have confounded the results. It seems that future large-scale studies are needed to clarify these differences.
6. Conclusions
The results of our study underscore the importance to employ simple and noninvasive instruments, as EEG, and cognitive–psychological tests, for early identification of patients at risk of developing neurological, psychological, and cognitive disorders. Could be important, also, carry out careful and constant monitoring of renal risk factors, probably involved in neuropsychological complications (inflammation, disorders of mineral metabolism, electrolyte disorders, etc.). Early identification and adequate therapy of neuropsychological, and cognitive disorders, might enable a better quality of life and a major compliance with a probable reduction in the healthcare costs. For this purpose a multidisciplinary interventions could be recommendable.
Footnotes
Abbreviations: 1,25-(OH)2D3 = 1,25-dihydroxyvitamin D3, BMI = body mass index, CARHES = Health Examination Survey study, CKD = chronic kidney disease, CRP = C-reactive protein, Cyn = cynicism, DST = digit span test, EEG = electroencephalogram, eGFR = estimated glomerular filtration rate, ESV = erythrocyte sedimentation velocity, GCs = guanidino compounds, GPT = Grooved Pegboard Test, HC = healthy controls, HD = hemodialysis, HDL = high-density lipoprotein, Hy = hysteria, iPTH = parathormone, KDOQI = Kidney Disease Outcomes Quality Initiative, KT = kidney transplantation, LDL = low-density lipoprotein, MDRD = Modification of Diet in Renal Disease, MMPI-2 = Minnesota multiphasic personality inventory, NHANES = National Health and Nutrition Examination Survey III, NPZ5 = neuropsychological test, Pa = paranoia, PD = peritoneal dialysis, Pd = psychopathic deviate, RAVL = Rey auditory verbal learning test, SAT-P = satisfaction profile, SDMT = symbol digit modalities test, TMTT = trail-making test.
The authors have no conflicts of interest to disclose.
The authors alone are responsible for the content and writing of the paper. The manuscript has been seen and approved by all authors. This study was not funded. The manuscript is not under consideration for publication elsewhere.
References
- [1].De Nicola L, Donfrancesco C, Minutolo R, et al. Epidemiologia della MRC in Italia: stato dell’arte e contributo dello studio CHARES. G Ital Nefrol 2011;28:401–7. [PubMed] [Google Scholar]
- [2].Coresh J, Astor BC, Greene T, et al. Prevalence of chronic kidneys disease and decreased kidney function in the adult US population: third NANHES. Am J Kidney Dis 2003;41:1–2. [DOI] [PubMed] [Google Scholar]
- [3].Baigent C, Burbury K, Wheeler D. Premature cardiovascular disease in chronic renal failure. Lancet 2000;356:147–52. [DOI] [PubMed] [Google Scholar]
- [4].Burn DJ, Bates D. Neurology and the kidney. J Neurol Neurosurg Psychiatry 1998;65:810–21. [DOI] [PMC free article] [PubMed] [Google Scholar]
- [5].Krishnan AV, Kiernan MC. Neurological complications of chronic kidney disease. Nat Rev Neurol 2009;5:542–51. [DOI] [PubMed] [Google Scholar]
- [6].Seifter JL, Samuels MA. Uremic encephalopathy and other brain disorders associated with renal failure. Emin Neurol 2011;31:139–43. [DOI] [PubMed] [Google Scholar]
- [7].Elias MF, Elias PK, Seliger SL, et al. Chronic kidney disease, creatinine and cognitive functioning. Nephrol Dial Transplant 2009;24:2446–52. [DOI] [PMC free article] [PubMed] [Google Scholar]
- [8].Kurella Tamura M, Wadley V, Yaffe K, et al. Kidney function and cognitive impairment in US adults: the Reasons for Geographic and Racial Differences in Stroke (REGARDS) Study. Am J Kidney Dis 2008;52:227–34. [DOI] [PMC free article] [PubMed] [Google Scholar]
- [9].Levey AS, Coresh J, Greene T, et al. Expressing the Modification of Diet in Renal Disease Study equation for estimating glomerular filtration rate with standardized serum creatinine values. Clin Chem 2007;53:766–72. [DOI] [PubMed] [Google Scholar]
- [10].Lai S, Molfino A, Russo GE, et al. Cardiac, inflammatory and metabolic parameters: hemodialysis versus peritoneal dialysis. Cardiorenal Med 2015;5:20–30. [DOI] [PMC free article] [PubMed] [Google Scholar]
- [11].Lai S, Coppola B, Dimko M, et al. Vitamin D deficiency, insulin resistance, and ventricular hypertrophy in the early stages of chronic kidney disease. Ren Fail 2014;36:58–64. [DOI] [PubMed] [Google Scholar]
- [12].Chen JB, Lam KK, Su YJ, et al. Relationship between Kt/V urea-based dialysis adequacy and nutritional status and their effect on the components of the quality of life in incident peritoneal dialysis patients. BMC Nephrol 2012;13:39. [DOI] [PMC free article] [PubMed] [Google Scholar]
- [13].Williams B, Poulter NR, Brown MJ, et al. British Hypertension Society guidelines for hypertension management 2004 (BHS-IV): summary. BMJ 2004;328:634–40. [DOI] [PMC free article] [PubMed] [Google Scholar]
- [14].Lai S, Dimko M, Galani A, et al. Early markers of cardiovascular risk in chronic kidney disease. Ren Fail 2015;37:254–61. [DOI] [PubMed] [Google Scholar]
- [15].Klem GH, Luders HO, Jasper HH, et al. The ten-twenty electrode system of the International Federation. The International Federation of Clinical Neurophysiology. Electroencephalogr Clin Neurophysiol Suppl 1999;52:3–6. [PubMed] [Google Scholar]
- [16].Amodio B, Marchetti P, Del Piccolo P, et al. Spectral versus visual EEG analysis in mild hepatic encephalopathy. Clin Neurophysiol 1999;10:1334–44. [DOI] [PubMed] [Google Scholar]
- [17].Mecarelli O, Pulitano P, Vicenzini E, et al. Observation on EEG patterns in neurally-mediated sincope: an inspective and quantitative study. Neurophysiol Clin 2004;34:203–7. [DOI] [PubMed] [Google Scholar]
- [18].Mecarelli O, Vicenzini E, Pulitano P, et al. Clinical, cognitive and neurophysiologic correlates of short-term treatment with carbamazepine, oxcabazepine, and levetiracetam in healthy volunteers. Ann Pharmcother 2004;38:1816–22. [DOI] [PubMed] [Google Scholar]
- [19].Meuti V, Marini I, Grillo A, et al. MMPI-2: cluster analysis of personality profiles in perinatal depression—preliminary evidence. ScientificWorldJournal 2014;2014:964210. [DOI] [PMC free article] [PubMed] [Google Scholar]
- [20].Abeni MS, Magni M, Conte M, et al. Psychological care of caregivers, nurses and physicians: a study of a new approach. Cancer Med 2014;3:101–10. [DOI] [PMC free article] [PubMed] [Google Scholar]
- [21].Shikuma CM, Nakamoto B, Shiramizu B, et al. Antiretroviral monocyte efficacy score linked to cognitive impairment in HIV. Antivir Ther 2012;17:1233–42. [DOI] [PMC free article] [PubMed] [Google Scholar]
- [22].De Deyn PP, D’Hooge R, Van Bogaert PP, et al. Endogenous guanidine compounds as uremic neurotoxins. Kidney Int 2001;59:S77–83. [DOI] [PubMed] [Google Scholar]
- [23].Liu M, Liang Y, Chigurupati S, et al. Acute kidney injury leads to inflammation and functional changes in the brain. J Am Soc Nephrol 2008;19:1360–70. [DOI] [PMC free article] [PubMed] [Google Scholar]
- [24].Fiaccadori E. Uremic encephalopathy: anything new? G Ital Nefrol 2009;26:9. [PubMed] [Google Scholar]
- [25].Driessen M, Wetterling T, Wedel T, et al. Secondary hyperparathyroidism and depression in chronic renal failure. Nephron 1995;70:334–9. [DOI] [PubMed] [Google Scholar]
- [26].Smogorzewski MJ. Central nervous dysfunction in uremia. Am J Kidney Dis 2001;38(4 suppl 1):S122–8. [DOI] [PubMed] [Google Scholar]
- [27].Cogan MG, Covey CM, Arieff AI, et al. Central nervous system manifestations of hyperparathyroidism. Am J Med 1978;65:963–70. [DOI] [PubMed] [Google Scholar]
- [28].Armstrong DJ, Meenagh GK, Bickle I, et al. Vitamin D deficiency is associated with anxiety and depression in fibromyalgia. Clin Rheumatol 2007;26:551–4. [DOI] [PubMed] [Google Scholar]
- [29].Jorde R, Waterloo K, Saleh F, et al. Neuropsychological function in relation to serum parathyroid hormone and serum 25-hydroxyvitamin D levels: the Tromso study. J Neurol 2006;253:464–70. [DOI] [PubMed] [Google Scholar]
- [30].Groves NJ, Kesby JP, Eyles DW, et al. Adult vitamin D deficiency leads to behavioural and brain neurochemical alterations in C57BL/6J and BALB/c mice. Behav Brain Res 2013;241:120–31. [DOI] [PubMed] [Google Scholar]
- [31].Hossein-nezhad A, Holick MF. Vitamin D for health: a global perspective. Mayo Clin Proc 2013;88:720–55. [DOI] [PMC free article] [PubMed] [Google Scholar]
- [32].Anglin RE, Samaan Z, Walter SD, et al. Vitamin D deficiency and depression in adults: systematic review and meta-analysis. Br J Psychiatry 2013;202:100–7. [DOI] [PubMed] [Google Scholar]
- [33].Mozaffari-Khosravi H, Nabizade L, Yassini-Ardakani SM, et al. The effect of 2 different single injections of high dose of vitamin D on improving the depression in depressed patients with vitamin D deficiency: a randomized clinical trial. J Clin Psychopharmacol 2013;33:378–85. [DOI] [PubMed] [Google Scholar]
- [34].Hoffmann MR, Senior PA, Mager DR. Vitamin D supplementation and health-related quality of life: a systematic review of the literature. J Acad Nutr Diet 2015;115:406–18. [DOI] [PubMed] [Google Scholar]
- [35].Vanholder R, Glorieux G, DeSmet R, et al. New insights in uremia toxins. Kidney Int Suppl 2003;63:6–10. [Google Scholar]
- [36].Singh NP, Sahni V, Wadhwa A, et al. Effect of improvement in anemia on electroneurophysiological markers (P300) of cognitive dysfunction in chronic kidney disease. Hemodial Int 2006;10:267–73. [DOI] [PubMed] [Google Scholar]
- [37].Lai S, Mariotti A, Coppola B, et al. Uricemia and homocysteinemia: nontraditional risk factors in the early stages of chronic kidney disease—preliminary data. Eur Rev Med Pharmacol Sci 2014;18:1010–7. [PubMed] [Google Scholar]
- [38].Guisado R, Arieff AL, Massry SG. Changes in the electroencephalogram in acute uremia: effects of parathyroid hormone and brain electrolytes. J Clin Invest 1975;55:738–40. [DOI] [PMC free article] [PubMed] [Google Scholar]
- [39].Cukor D, Ver Halen N, Asher DR, et al. Psychosocial intervention improves depression, quality of life, and fluid adherence in hemodialysis. J Am Soc Nephrol 2014;25:196–206. [DOI] [PMC free article] [PubMed] [Google Scholar]
- [40].Khalil AA, Frazier SK. Depressive symptoms and dietary nonaadherence: a systematic review of randomized-controlled trials. Hemodial Int 2010;14:370–82. [DOI] [PubMed] [Google Scholar]


