
Figure 1.
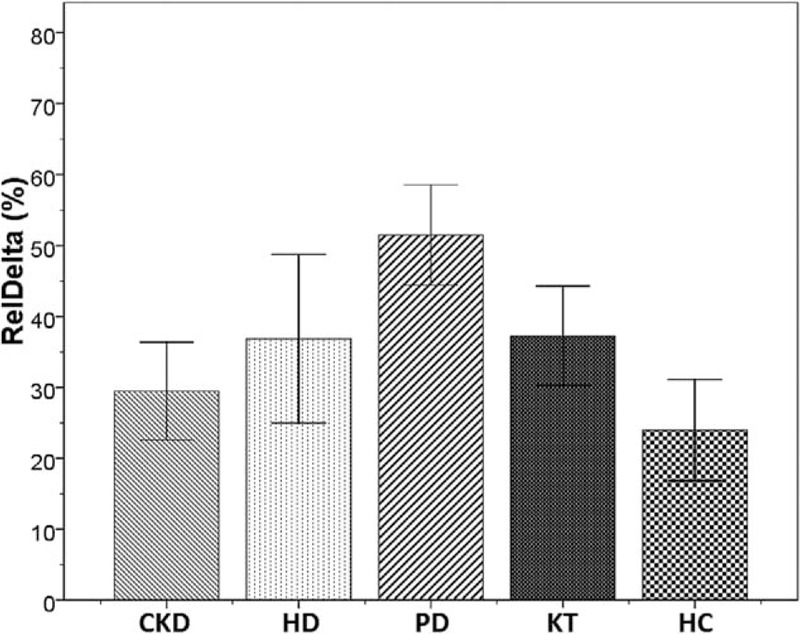
Bar charts with error bars. The mean value of relative power of delta band (%) was significantly higher in patients on peritoneal dialysis (PD), compared with control group (51.5 ± 12.3 vs 23.9 ± 14.3, ∗P < 0.001). Boxes represent means; error bars indicate the 95% of CI (confidence interval). CKD = chronic kidney disease, HC = healthy controls, HD = hemodialysis, KT = kidney transplantation, PD = peritoneal dialysis, RelDelta = relative power of delta band.