Figure 5.

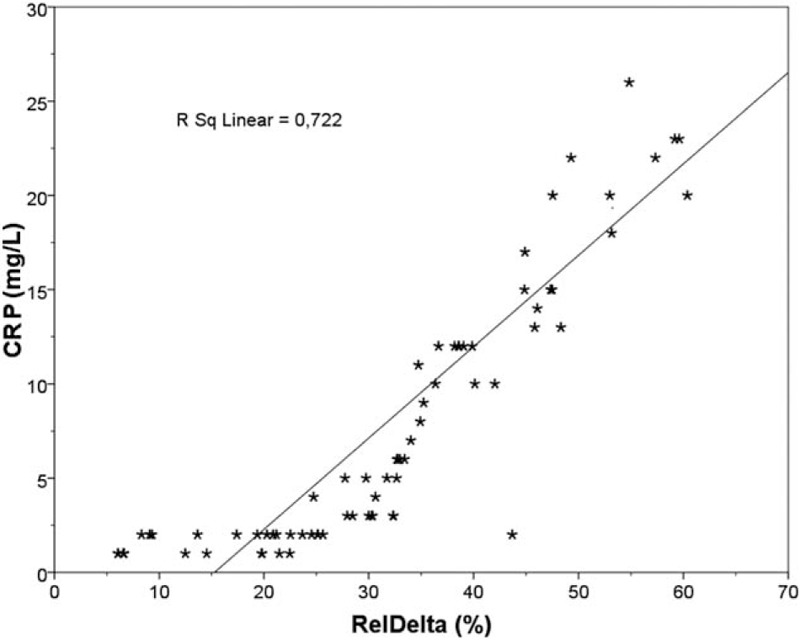
Linear regression plot. CRP (mg/L) vs RelDelta (%) in overall population. Positive correlation was found between the 2 parameters (r = 0.850, P < 0.001). CRP = C reactive protein, RelDelta = relative power of delta band.

Linear regression plot. CRP (mg/L) vs RelDelta (%) in overall population. Positive correlation was found between the 2 parameters (r = 0.850, P < 0.001). CRP = C reactive protein, RelDelta = relative power of delta band.