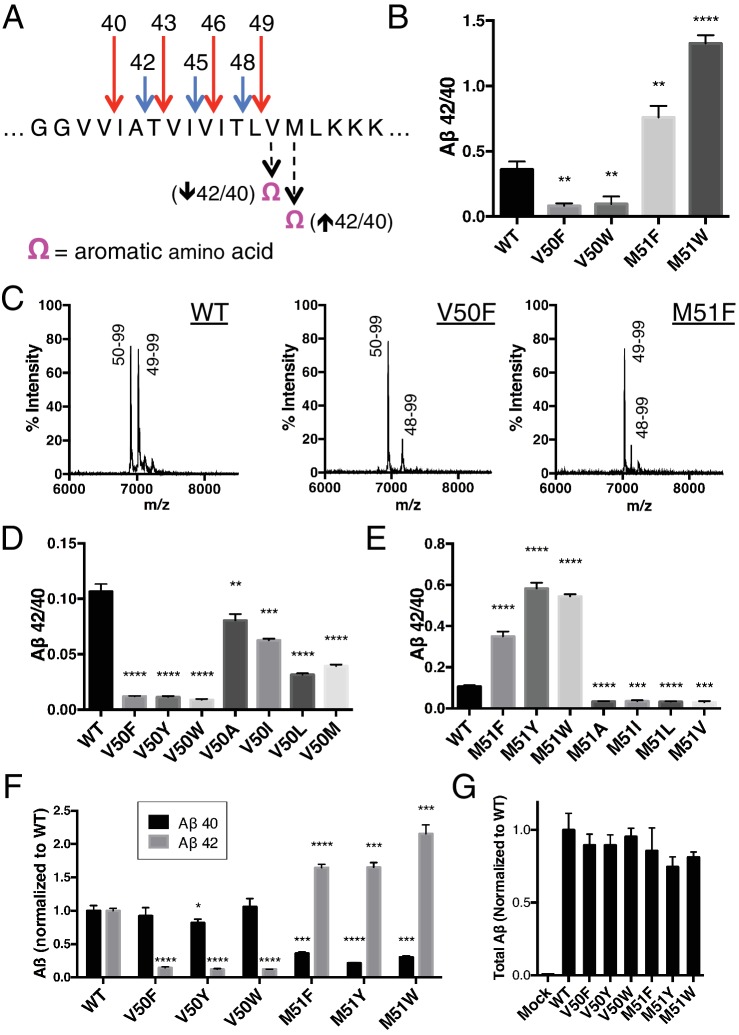
Figure 2. Selective blocking of the Aβ40 or Aβ42 pathways with aromatic amino acids placed at the P2’ position of ε cleavage.
(A) Schematic diagram of the TMD of APP with pathway blocking aromatic amino acid mutations at the P2’ position for the T48 or L49 ε cleavage. (B) In vitro Aβ42/40 ratios with Phe or Trp mutations at V50 or M51. Aβ measured using Aβ40 and Aβ42 ELISA kits from Invitrogen. Mean ± SD, n = 3, t-test **<0.01, ****<0.0001. (C) MALDI/TOF MS of the AICD fragments generated from in vitro cleavage of C100: WT (AICD 50–99, expected mass: 6905.6, observed mass: 6907.4; AICD 49–99, expected mass: 7018.8, observed mass: 7021.3). V50F (AICD 50–99, expected mass: 6953.8, observed mass: 6949.8; AICD 48–99, expected mass: 7167.9, observed mass: 7163.5). M51F (AICD 49–99, expected mass: 7034.8, observed mass: 7030.1; AICD 48–99, expected mass: 7135.8, observed mass: 7131.8). (D) Aβ42/40 ratios measured from the media of HEK cells transfected with V50 mutants. Aβ levels measured by 6E10 ELISA. Mean ± SD, n = 3, t-test **<0.01, ***<0.001, ****<0.0001. (E) Aβ42/40 ratios measured from the media of HEK cells transfected with M51 mutants. Aβ levels measured by 6E10 ELISA. Mean ± SD, n = 3, t-test ***<0.001, ****<0.0001. (F) Aβ40 and Aβ42 levels for aromatic substitutions at V50 and M51 normalized to WT. Aβ levels measured by 6E10 ELISA. Mean ± SD, n = 3, t-test *<0.05, ***<0.001, ****<0.0001. (G) Total secreted Aβ levels (see Materials and methods) from the aromatic mutations at V50 and M51.

