
Figure 2.
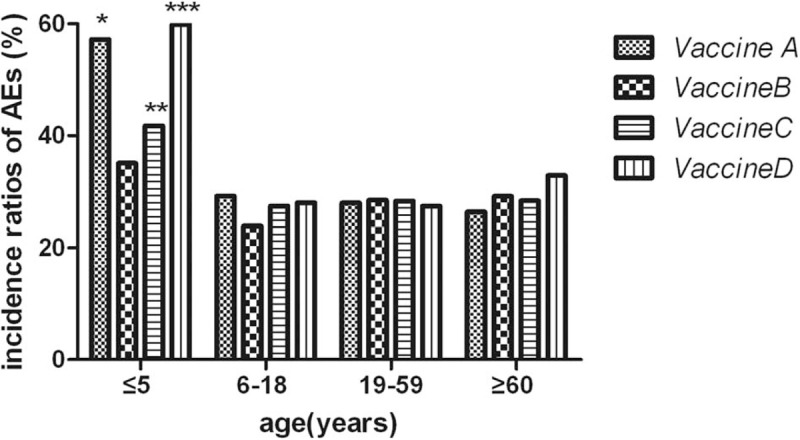
Comparison of AEs among 4 different age groups of each vaccine group. “∗” means in Group A: compared with other 3 subgroups (6–18, 19–59, and ≥60-year-old groups), incidence ratio of AEs in ≤5-year-old group was significantly increased (all of 3 P values <0.001). “∗∗” means in Group C: compared with other 3 subgroups (6–18, 19–59, and ≥60-year-old groups), incidence ratio of AEs in ≤5-year-old group was significantly increased (P <0.001, = 0.002, = 0.004 respectively). “∗∗∗” means in Group D: compared with other 3 subgroups (6–18, 19–59, and ≥60-year-old groups), incidence ratio of AEs in ≤5-year-old group was significantly increased (all of 3 P values <0.001). AEs = adverse events.